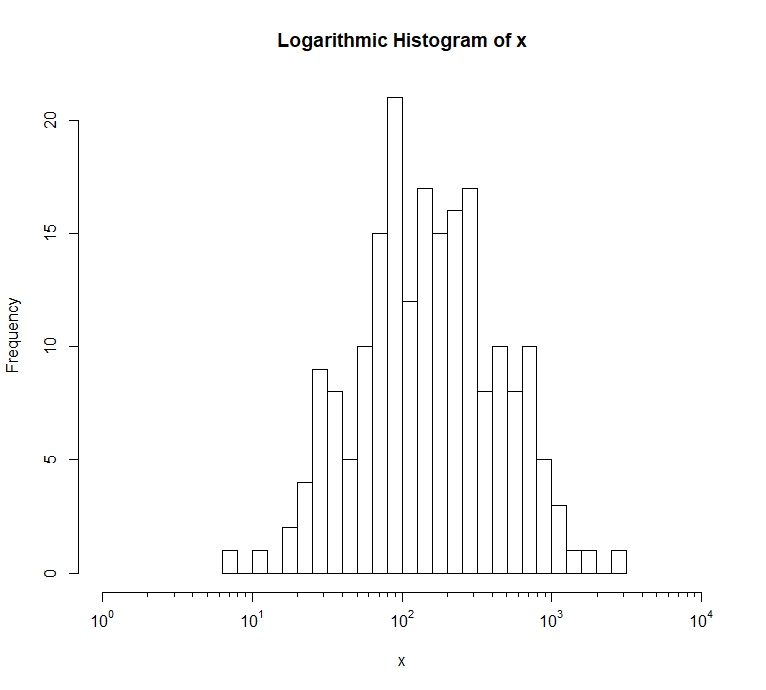
我有一个正态分布图和一个直方图,x 轴以对数刻度显示 0、10^0、10^1 ...我想在主要刻度之间包含次要刻度。实际上,我可以使用 上一个问题。我对主要刻度使用了以下代码:
major.ticks <- axTicks(1)
labels <- sapply(major.ticks,function(i)
            as.expression(bquote(10^ .(i)))
          )
axis(1,at=major.ticks,labels=labels)
可以对其进行编辑以仅标记次要刻度而不对其进行标记吗?
I have a normal distribution plot and a histogram plot with x axis in log scale displaying 0, 10^0, 10^1 ... I want to include minor ticks between the major ones. Actually I was able to change the major ticks format from 1, 2, 3 and so on to 10^0, 10^1, 10^2, 10^3 using the solution given to me in my previous question. I used the following code for the major ticks :
major.ticks <- axTicks(1)
labels <- sapply(major.ticks,function(i)
            as.expression(bquote(10^ .(i)))
          )
axis(1,at=major.ticks,labels=labels)
Can this be edited to just mark the minor ticks without labeling them?


发布评论
评论(7)
Hmisc包中有一个函数minor.tick,但该函数对对数标度的处理效果很差。我使用以下函数来获取遵循对数刻度的小刻度。ax是您使用它的轴(与函数axis相同),n是小刻度数(默认为 9) ,t.ratio是主要刻度和次要刻度之间的比率,并且使用...您可以将额外的参数传递给axisedit :评论中的好主意,所以我编辑了我的函数。有两个额外参数,
mn和mx,分别表示对数刻度上的最小值和最大值 (mn=0 因此意味着最小值为 10^0 或 1!)函数:
这可以按如下方式应用:
给出:
There is a function
minor.tickin the packageHmisc, but that one deals poorly with logarithmical scales. I use the following function for getting minor ticks that follow the logarithmical scale.axis the axis you use it on (same as for the functionaxis),nis the number of minor ticks (default to 9),t.ratiois the ratio between the major and the minor ticks, and with...you can pass extra parameters toaxisedit : Nice idea in the comments, so I edited my function. There are two extra parameters,
mnandmxfor the minimum and the maximum on the logarithmic scale (mn=0thus means the minimum is 10^0 or 1 !)The function:
This can be applied as follows :
Gives :
这是一个简单的函数:
这是一个例子:
给出:

Here is a simple function to to this:
Here is an example:
Gives:

尝试magicaxis 包中的
magaxis。Try
magaxisin package magicaxis.在
ggplot2中,我们可以使用annotation_logticks< /a> 以及scales::trans_breaks和scales::trans_format。下面是从上面的链接中获取的示例。In
ggplot2, we can useannotation_logtickstogether withscales::trans_breaksandscales::trans_format. Below is an example taken from the link above.StratigrapheR包中有一个minorAxis函数,可用于任何类型的次要刻度。它可以与 seq_log 函数一起使用来制作对数刻度:给出:
There is the
minorAxisfunction in theStratigrapheRpackage, that can be used for any kind of minor ticks. It can be used with theseq_logfunction to make logarithmic ticks:Gives:
使用
""作为小刻度的标签。Use
""for the labels of the minor ticks.出现一个小错误,
缺少
lims<-lims[3:4]There was a small error,
lims<-lims[3:4]was missing