Canvas tutorial - Web APIs 编辑

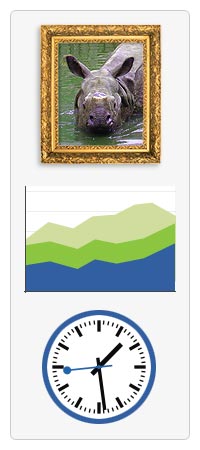
<canvas> is an HTML element which can be used to draw graphics via scripting (usually JavaScript). This can, for instance, be used to draw graphs, combine photos, or create simple (and not so simple) animations. The images on this page show examples of <canvas> implementations which will be created in this tutorial.
This tutorial describes how to use the <canvas> element to draw 2D graphics, starting with the basics. The examples provided should give you some clear ideas about what you can do with canvas, and will provide code snippets that may get you started in building your own content.
First introduced in WebKit by Apple for the OS X Dashboard, <canvas> has since been implemented in browsers. Today, all major browsers support it.
Before you start
Using the <canvas> element is not very difficult, but you do need a basic understanding of HTML and JavaScript. The <canvas> element is not supported in some older browsers, but is supported in recent versions of all major browsers. The default size of the canvas is 300 pixels × 150 pixels (width × height). But custom sizes can be defined using the HTML height and width property. In order to draw graphics on the canvas we use a JavaScript context object, which creates graphics on the fly.
In this tutorial
- Basic usage
- Drawing shapes
- Applying styles and colors
- Drawing text
- Using images
- Transformations
- Compositing and clipping
- Basic animations
- Advanced animations
- Pixel manipulation
- Hit regions and accessibility
- Optimizing the canvas
- Finale
See also
A note to contributors
Due to an unfortunate technical error that occurred the week of June 17, 2013, we lost the history of this tutorial, including attributions to all past contributors to its content. We apologize for this, and hope you'll forgive this unfortunate mishap.
如果你对这篇内容有疑问,欢迎到本站社区发帖提问 参与讨论,获取更多帮助,或者扫码二维码加入 Web 技术交流群。

绑定邮箱获取回复消息
由于您还没有绑定你的真实邮箱,如果其他用户或者作者回复了您的评论,将不能在第一时间通知您!

发布评论