@abi-software/plotvuer 中文文档教程
plotvuer
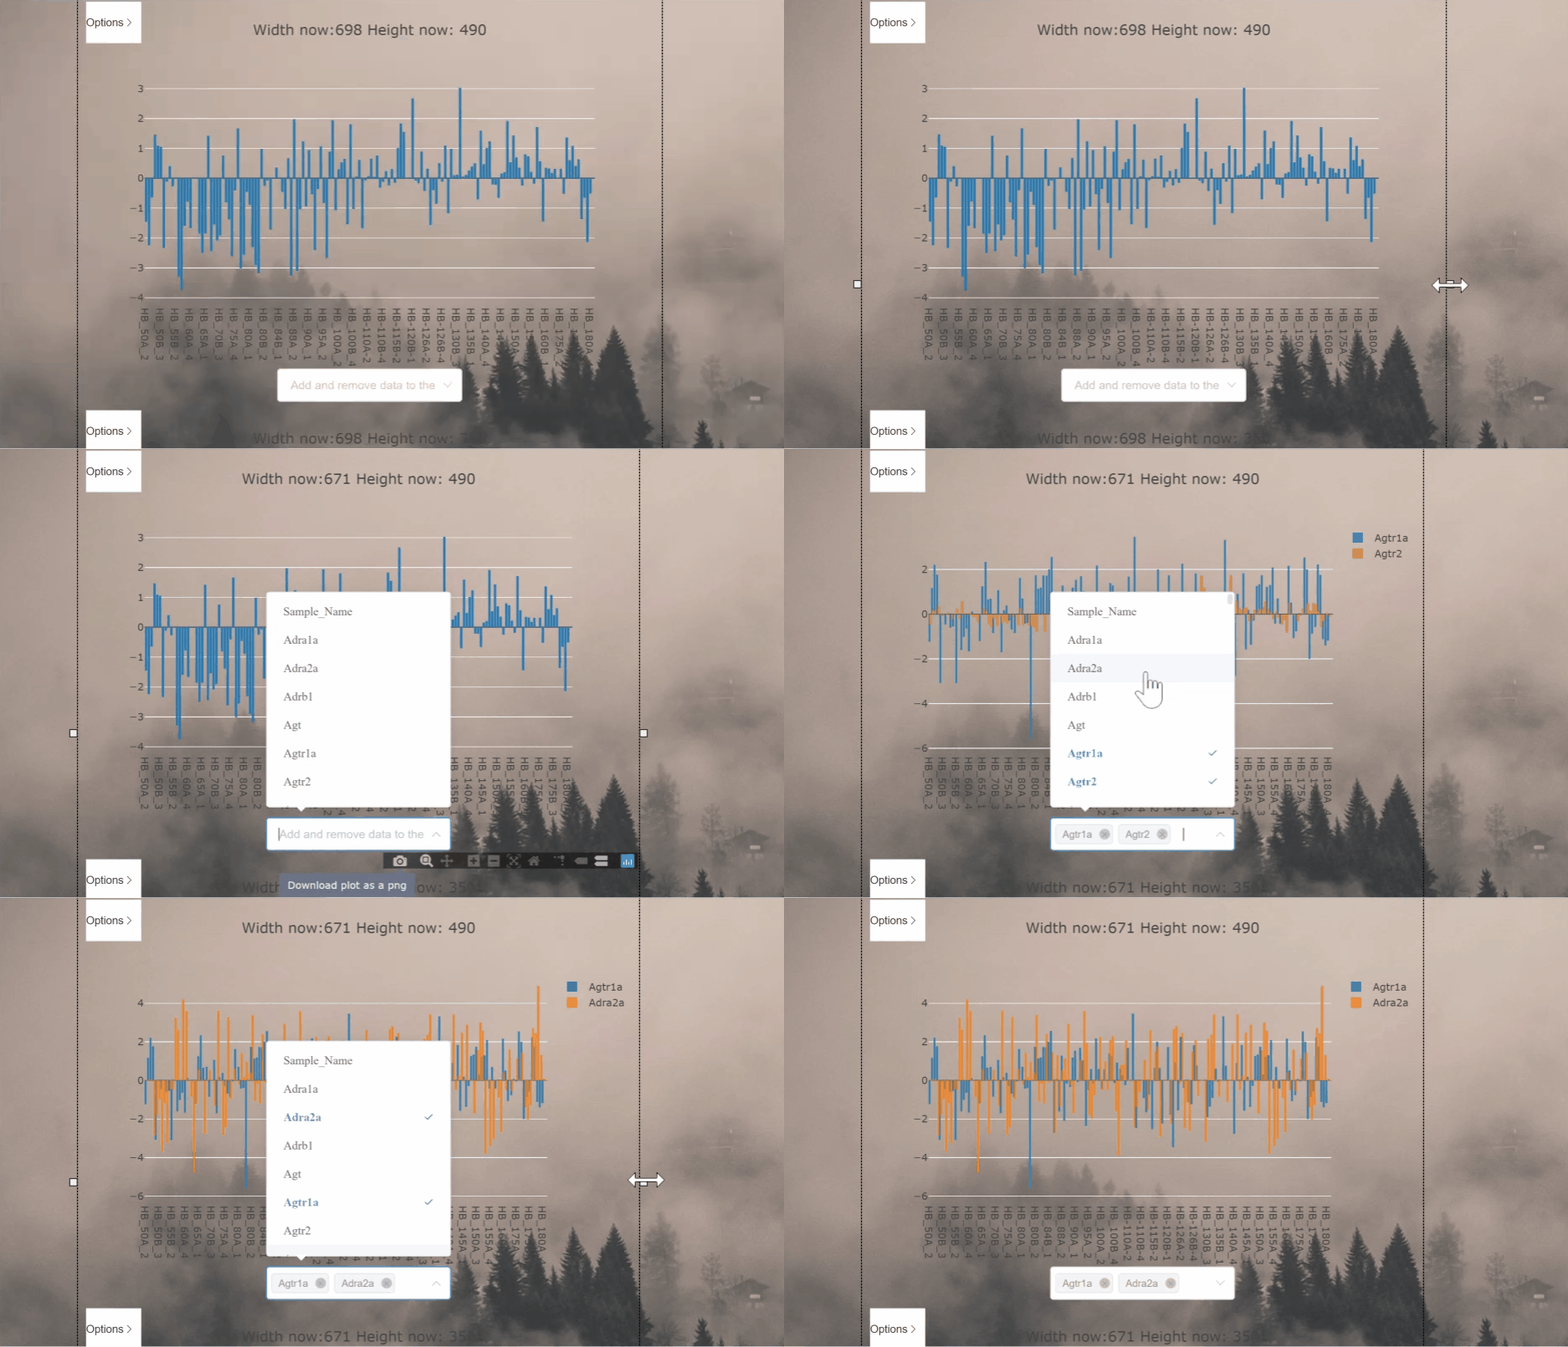
该项目旨在在 vue 框架中将 csv 文件处理和显示为图形 在
此处*。
*演示将在 Heroku 服务器启动时加载 30 秒

不想编码? 查看如何将 plotvuer 复制并粘贴为 HTML 小部件 here
Project installation
npm i @abi-software/plotvuer
Project setup
npm install
npm run serve
Compiles and minifies for production
npm run build-bundle
How to use
在您的脚本中包含该包。
import { PlotVuer } from '@abi-software/plotvuer'
import '@abi-software/plotvuer/dist/plotvuer.css'
vue 组件中的本地注册:
export default {
  ...
  components: {
    PlotVuer,
  }
  ...
}
上面的代码片段将 Plotvuer 组件注册到全局范围。 您现在可以在 vue 模板中使用 Plotvuer,如下所示:
<PlotVuer :url="csvfile.csv"></PlotVuer>
可选参数:
- Type of plot - Use 'scatter, 'heatmap', or 'barplot'.
- Plot filters - Filters will preload the plot with the supplied data
<PlotVuer :url="csvfile.csv" :plotType="'scatter'" :xAxisFilter="['step1', 'step2']"></PlotVuer>
url 应该是包含 csv 文件 url 的变量/字符串。
plotType 是我们希望将数据视为以下之一的绘图类型:'heatmap'、'scatter'、'barplot'
xAxisFilter 和yAxisFilter 提供过滤器以加载显示选定过滤器的绘图。
CSV file formatting
plotvuer 将加载 csv 文件,该文件遵循第一行和第一列标题的形式,如果数据是基于时间的,则行将被假定为与时间相关。
Example 1. Heatmap data
| Gene 1 | Gene 2 | |
|---|---|---|
| Sample 1 | -1.54 | -3.40 |
| Sample 2 | 0.68 | 1.22 |
| Sample 3 | 0.05 | 0.66 |
Example 2. Timeseries data
| time (seconds) | Sweep 0_Membrane Potential (mV) |
|---|---|
| 0 | -70.12939453 |
| 0.0002 | -70.12939453 |
| 0.0004 | -70.34301758 |
Copy and paste as an HTML widget
将以下行粘贴到您的 HTML
 <!-- Modify the 'file' input to point to a csv file you wish to show -->
 <plot-vuer-widget file="https://mapcore-bucket1.s3-us-west-2.amazonaws.com/ISAN/csv-data/use-case-4/RNA_Seq.csv"></plot-vuer-widget>
 <!-- widget source css from cdn-->
 <link href="https://cdn.jsdelivr.net/npm/@tehsurfer/plotvuer-widget/dist/plotVuer.css" rel="stylesheet">
 <!-- widget source js from cdn -->
 <script src="https://cdn.jsdelivr.net/npm/@tehsurfer/plotvuer-widget/dist/plotVuer.js"></script>
Modifying input file for widget
更改此行以指向 csv 文件以供显示
 <!-- Modify the 'file' input to point to a csv file you wish to show -->
 <plot-vuer-widget file="./path/to/file.csv"></plot-vuer-widget>
plotvuer
This project aims to process and display csv files as graphs in the vue framework
Demo the site functionality of this app here*.
*Demo will take 30s to load while Heroku server boots

Don't feel like coding? See how to copy and paste plotvuer as an HTML widget here
Project installation
npm i @abi-software/plotvuer
Project setup
npm install
npm run serve
Compiles and minifies for production
npm run build-bundle
How to use
Include the package in your script.
import { PlotVuer } from '@abi-software/plotvuer'
import '@abi-software/plotvuer/dist/plotvuer.css'
Local registration in vue component:
export default {
  ...
  components: {
    PlotVuer,
  }
  ...
}
The snippet above registers the Plotvuer component into the global scope. You can now use the Plotvuer in your vue template as followed:
<PlotVuer :url="csvfile.csv"></PlotVuer>
Optional Parameters:
- Type of plot - Use 'scatter, 'heatmap', or 'barplot'.
- Plot filters - Filters will preload the plot with the supplied data
<PlotVuer :url="csvfile.csv" :plotType="'scatter'" :xAxisFilter="['step1', 'step2']"></PlotVuer>
url should be the variable/string containing the url of a csv file.
plotType is the type of plot we wish to see the data as one of: 'heatmap', 'scatter', 'barplot'
xAxisFilter and yAxisFilter provide filters to load the plot with selected filters displayed.
CSV file formatting
plotvuer will load and csv file that follow the form of headers on first row and coloumn and if data is time based, rows will be assumed to be time dependant.
Example 1. Heatmap data
| Gene 1 | Gene 2 | |
|---|---|---|
| Sample 1 | -1.54 | -3.40 |
| Sample 2 | 0.68 | 1.22 |
| Sample 3 | 0.05 | 0.66 |
Example 2. Timeseries data
| time (seconds) | Sweep 0_Membrane Potential (mV) |
|---|---|
| 0 | -70.12939453 |
| 0.0002 | -70.12939453 |
| 0.0004 | -70.34301758 |
Copy and paste as an HTML widget
Paste the following lines in the <body> of you HTML
 <!-- Modify the 'file' input to point to a csv file you wish to show -->
 <plot-vuer-widget file="https://mapcore-bucket1.s3-us-west-2.amazonaws.com/ISAN/csv-data/use-case-4/RNA_Seq.csv"></plot-vuer-widget>
 <!-- widget source css from cdn-->
 <link href="https://cdn.jsdelivr.net/npm/@tehsurfer/plotvuer-widget/dist/plotVuer.css" rel="stylesheet">
 <!-- widget source js from cdn -->
 <script src="https://cdn.jsdelivr.net/npm/@tehsurfer/plotvuer-widget/dist/plotVuer.js"></script>
Modifying input file for widget
Change this line to point at a csv file for display
 <!-- Modify the 'file' input to point to a csv file you wish to show -->
 <plot-vuer-widget file="./path/to/file.csv"></plot-vuer-widget>
