@29aries/react-apexcharts 中文文档教程

ApexCharts 的 React.js 包装器,用于在 React 中构建交互式可视化。
Download and Installation
Installing via npm
npm install react-apexcharts apexcharts
Usage
import Chart from 'react-apexcharts'
创建一个具有最小配置的基本条形图,编写如下:
class App extends Component {
  constructor(props) {
    super(props);

    this.state = {
      options: {
        chart: {
          id: 'apexchart-example'
        },
        xaxis: {
          categories: [1991, 1992, 1993, 1994, 1995, 1996, 1997, 1998, 1999]
        }
      },
      series: [{
        name: 'series-1',
        data: [30, 40, 35, 50, 49, 60, 70, 91, 125]
      }]
    }
  }
  render() {
    return (
      <Chart options={this.state.options} series={this.state.series} type="bar" width={500} height={320} />
    )
  }
}
这将呈现以下图表
How do I update the chart?
简单! 只需更改 series 或任何 option,它就会自动重新呈现图表。
重要:更新选项时,即使需要更新嵌套属性,也要确保更新最外层的属性。
✅ 这样做
this.setState({
  options: {
    ...this.state.options,
    xaxis: {
      ...this.state.options.xaxis,
      categories: ['X1', 'X2', 'X3']
    }
  }
})
❌ 不是这样
this.setState({
  options.xaxis.categories: ['X1', 'X2', 'X3']
})
Props
| Prop | Type | Description |
|---|---|---|
| series | Array | The series is an array which accepts object in the following format. To know more about the format of dataSeries, checkout Series docs on the website. |
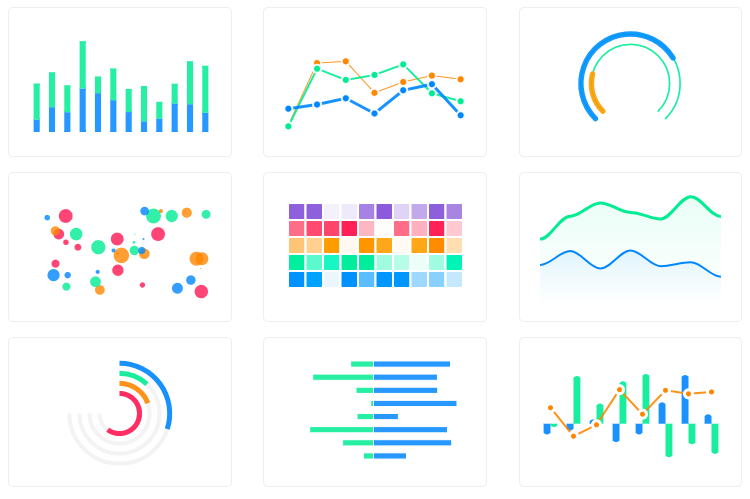
| type | String | line, area, bar, pie, donut, scatter, bubble, heatmap, radialBar |
| width | Number/String | Possible values for width can be 100% or 400px or 400 |
| height | Number/String | Possible values for width can be 100% or 300px or 300 |
| options | Object | The configuration object, see options on API (Reference) |
How to call methods of ApexCharts programatically?
有时,您可能想调用核心 ApexCharts 库的其他方法,您可以直接在 ApexCharts 全局变量上这样做
Example
ApexCharts.exec('reactchart-example', 'updateSeries', [{
  data: [40, 55, 65, 11, 23, 44, 54, 33]
}])
有关 .exec() 的更多信息 方法可以在这里找到
ApexCharts 的所有其他方法都可以通过这种方式调用
What's included
存储库包括以下文件和目录。
react-apexcharts/
├── dist/
│   ├── react-apexcharts.min.js
│   └── react-apexcharts.js
└── example/
│   ├── src/
│   ├── public/
│   ├── package.json
│   └── README.md
└── src/
    └── react-apexcharts.jsx
Development
Install dependencies
npm install
Running the example
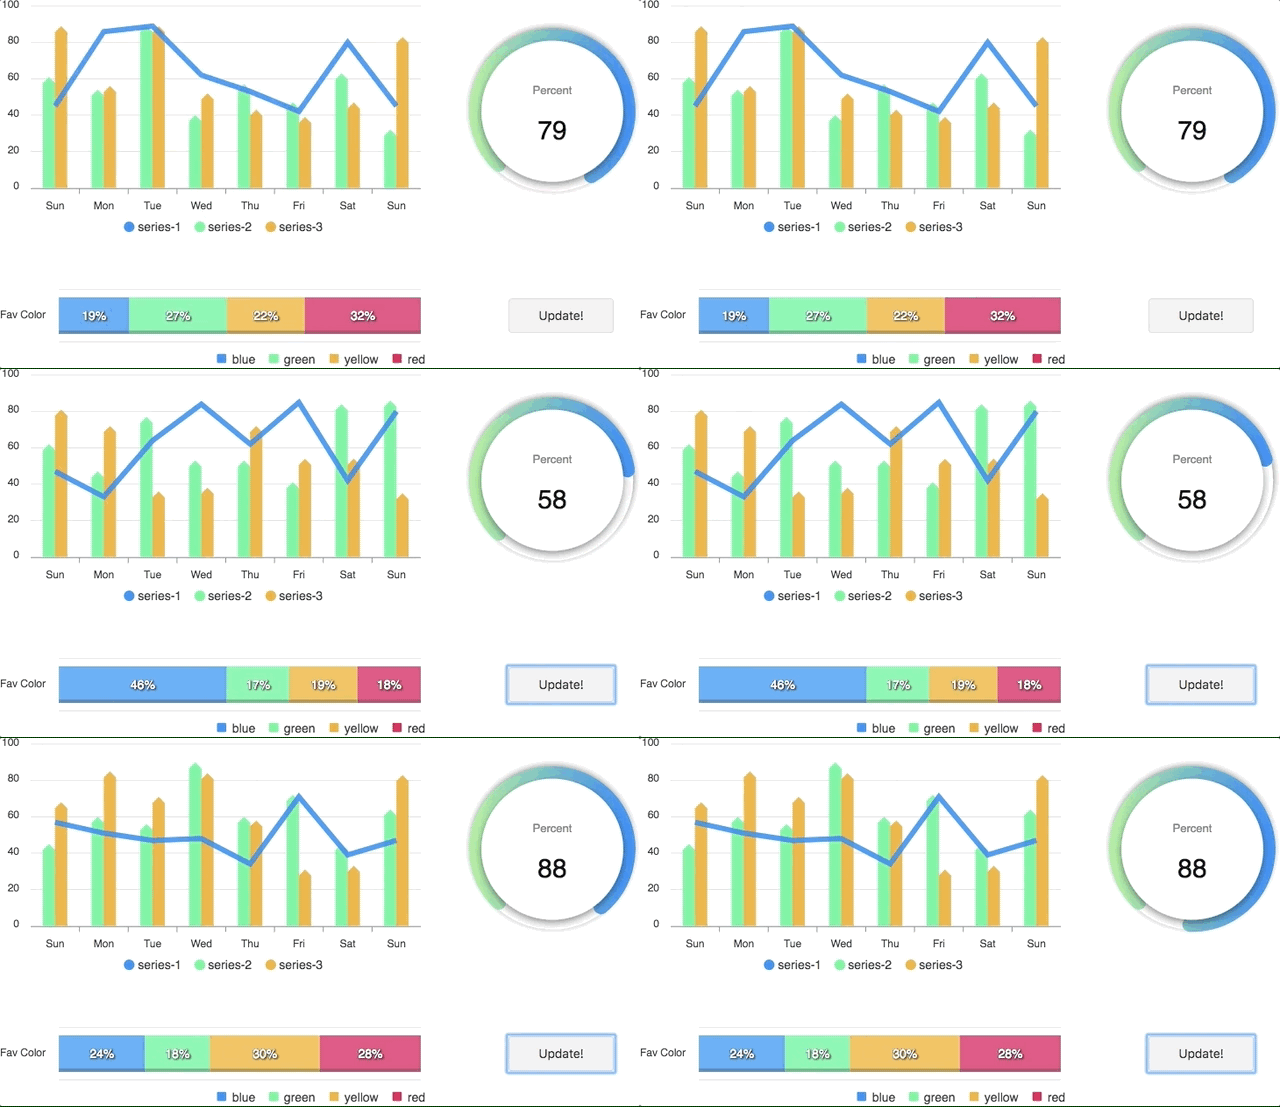
包括更新在内的基本示例展示了如何轻松开始使用 ApexCharts 和 React。
为了运行示例,
cd example
npm install
npm run start
Bundling
To build for Development
npm run dev-build
To build for Production
npm run build
License
React-ApexCharts 在 MIT 许可下发布。 只要保留版权标头,您就可以自由使用、修改和分发该软件。

React.js wrapper for ApexCharts to build interactive visualizations in react.
Download and Installation
Installing via npm
npm install react-apexcharts apexcharts
Usage
import Chart from 'react-apexcharts'
To create a basic bar chart with minimal configuration, write as follows:
class App extends Component {
  constructor(props) {
    super(props);

    this.state = {
      options: {
        chart: {
          id: 'apexchart-example'
        },
        xaxis: {
          categories: [1991, 1992, 1993, 1994, 1995, 1996, 1997, 1998, 1999]
        }
      },
      series: [{
        name: 'series-1',
        data: [30, 40, 35, 50, 49, 60, 70, 91, 125]
      }]
    }
  }
  render() {
    return (
      <Chart options={this.state.options} series={this.state.series} type="bar" width={500} height={320} />
    )
  }
}
This will render the following chart
How do I update the chart?
Simple! Just change the series or any option and it will automatically re-render the chart.
View this example on codesandbox
Important: While updating the options, make sure to update the outermost property even when you need to update the nested property.
✅ Do this
this.setState({
  options: {
    ...this.state.options,
    xaxis: {
      ...this.state.options.xaxis,
      categories: ['X1', 'X2', 'X3']
    }
  }
})
❌ Not this
this.setState({
  options.xaxis.categories: ['X1', 'X2', 'X3']
})
Props
| Prop | Type | Description |
|---|---|---|
| series | Array | The series is an array which accepts object in the following format. To know more about the format of dataSeries, checkout Series docs on the website. |
| type | String | line, area, bar, pie, donut, scatter, bubble, heatmap, radialBar |
| width | Number/String | Possible values for width can be 100% or 400px or 400 |
| height | Number/String | Possible values for width can be 100% or 300px or 300 |
| options | Object | The configuration object, see options on API (Reference) |
How to call methods of ApexCharts programatically?
Sometimes, you may want to call other methods of the core ApexCharts library, and you can do so on ApexCharts global variable directly
Example
ApexCharts.exec('reactchart-example', 'updateSeries', [{
  data: [40, 55, 65, 11, 23, 44, 54, 33]
}])
More info on the .exec() method can be found here
All other methods of ApexCharts can be called this way
What's included
The repository includes the following files and directories.
react-apexcharts/
├── dist/
│   ├── react-apexcharts.min.js
│   └── react-apexcharts.js
└── example/
│   ├── src/
│   ├── public/
│   ├── package.json
│   └── README.md
└── src/
    └── react-apexcharts.jsx
Development
Install dependencies
npm install
Running the example
Basic example including update is included to show how to get started using ApexCharts with React easily.
To run the examples,
cd example
npm install
npm run start
Bundling
To build for Development
npm run dev-build
To build for Production
npm run build
License
React-ApexCharts is released under MIT license. You are free to use, modify and distribute this software, as long as the copyright header is left intact.


