使用Imshow和Cartopy正确地将图像与正弦投影对齐
我正在尝试使用iMshow绘制使用正弦投影的图像,但是如果我使用 transform = ccrs.sinusoidal(central_longitude = 128)它根本不起作用,并且使用transform = ccrs.platecarree( )海岸线和图像不符合。这是我的代码:
import matplotlib.pyplot as plt
import cartopy.crs as ccrs
import numpy as np
plt.figure(figsize=(8, 8))
ax = plt.axes(projection=ccrs.PlateCarree())
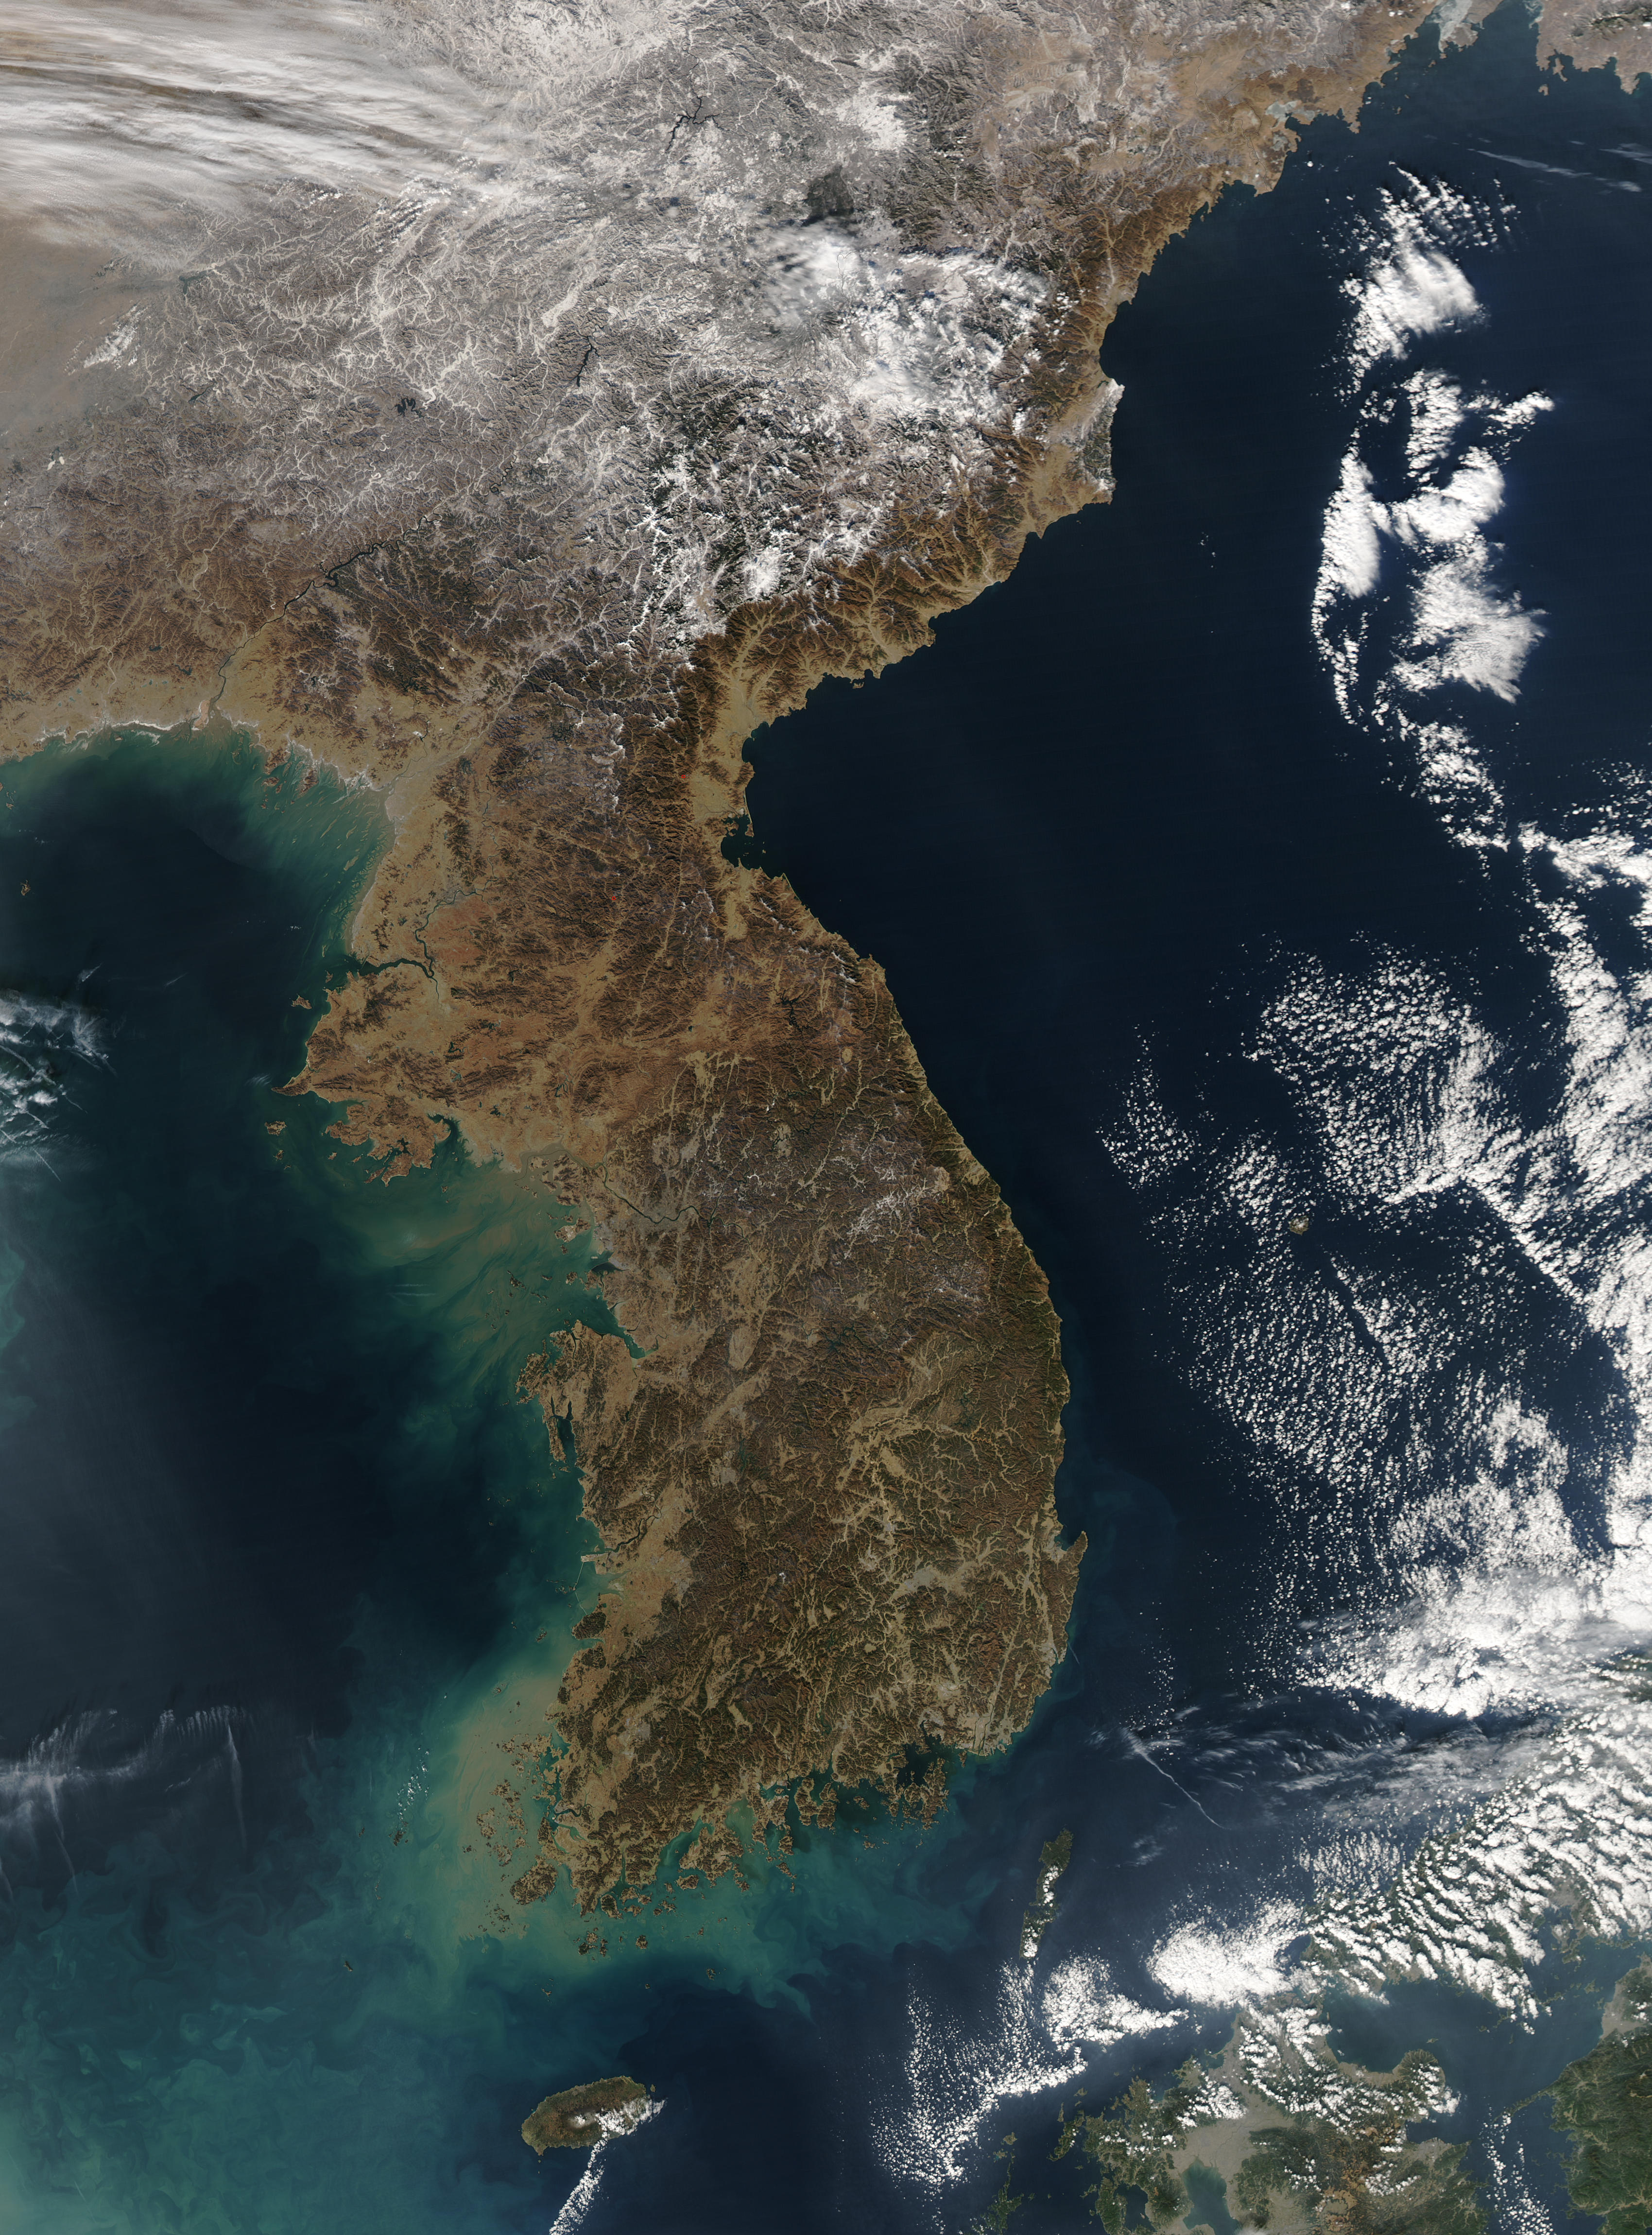
img_extent = (122.8109, 133.2922, 32.8286, 43.1708)
img = plt.imread('Korea.A2004004.0445.250m.jpg')
ax.coastlines(resolution='10m')
ax.imshow(img, origin='upper', extent=img_extent, transform=ccrs.PlateCarree())
plt.show()
如果你对这篇内容有疑问,欢迎到本站社区发帖提问 参与讨论,获取更多帮助,或者扫码二维码加入 Web 技术交流群。

绑定邮箱获取回复消息
由于您还没有绑定你的真实邮箱,如果其他用户或者作者回复了您的评论,将不能在第一时间通知您!


发布评论