使用 matlab 绘图进行 X 轴缩放
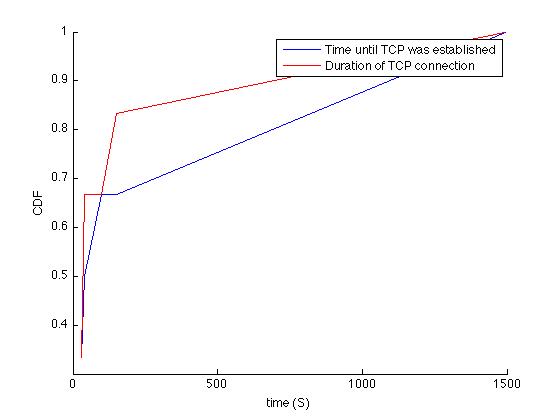
我的数据稀疏,因此当我绘制图表时,我得到以下结果 
如您所见,第一个 x 轴刻度从 500(s) 开始,但我的大部分数据是大约 30(s)。我可以更改 x 轴的缩放比例吗?
My data is sparse therefore when I plot my graph I get the following result
As you can see the first x axis tick starts at 500(s), but most of my data is around 30(s). Can I change the scaling of the x axis?
如果你对这篇内容有疑问,欢迎到本站社区发帖提问 参与讨论,获取更多帮助,或者扫码二维码加入 Web 技术交流群。

绑定邮箱获取回复消息
由于您还没有绑定你的真实邮箱,如果其他用户或者作者回复了您的评论,将不能在第一时间通知您!

发布评论
评论(2)
如果您只想显示 0 到 30 秒的数据,您可以只绘制如下所示的数据:
或者您可以仅在图上表示
XLim。If you want to display data from 0 to 30s only you can either plot only those like this:
or you can just express
XLimits on the figure.这个怎么样?
我看到以下输出:
How about this?
I see the following output: