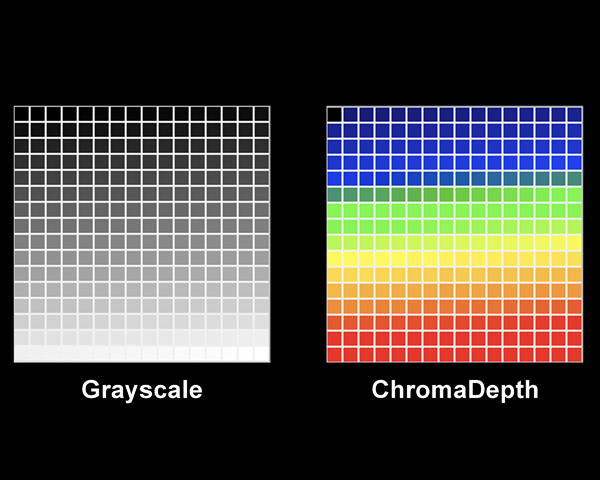
指定用于有序值的 RGB 调色板
我有一个函数 f(x,y),主要是单调的,它产生范围为 {0.0 .. 100.0} 的一些值。我想使用不同的颜色将它们绘制为二维图片,其中 (x,y) 是坐标,不同的颜色代表函数的不同值。问题如下:我不知道如何将该函数的值映射到 RGB 颜色空间并保留顺序(明显)。我已经发现了。喜欢:
R = f(x,y) * 10.0f;
G = f(x,y) * 20.0f;
B = f(x,y) * 30.0f;
color = B<<16|G<<8|R; //@low-endian
效果很好,但生成的图片太暗。如果我增加这些常量,事情并不会变得更好,因为在某些时刻,颜色分量将大于 0xFF,因此它会溢出(一个颜色分量应该在 {0 .. 0xFF} 范围内。
你知道吗?如何将值从 {0.0 .. 100.0} 映射到
RGB=[{0 .. 0xFF}<<16|{0 .. 0xFF}<<8|{0 .. 0xFF}] 这样得到的 RGB 值是可见的?
PS:也许你知道,在网上哪里可以找到更多相关理论的信息?我只记得 Foley/Van Dam 的 Comp.Graphics,但我没有这本书。
更新:我正在寻找如何生成像右边这样的色度调色板: 
I have a function f(x,y), mostly monotonic, which produces some values in the range {0.0 .. 100.0}. I would like to draw them using different colors as a 2D picture, where (x,y) are coordinates and where distinctive colors stand for distinctive values of the function. The problem is following: I don't know how to map the values of this function to RGB color space preserving the order (visibly). I have found that smth. like:
R = f(x,y) * 10.0f;
G = f(x,y) * 20.0f;
B = f(x,y) * 30.0f;
color = B<<16|G<<8|R; //@low-endian
works fine, but the resulting picture is too dark. If I increase these constants, it makes things not better, because at some moment a color component will be greater than 0xFF, so it will overflow (one color component should be in the range {0 .. 0xFF}.
Do you have any idea how to map values from {0.0 .. 100.0} to
RGB=[{0 .. 0xFF}<<16|{0 .. 0xFF}<<8|{0 .. 0xFF}] so that the resulting RGB values are visibly Ok?
PS: maybe you know, where to find more info about related theory online? I remember only Comp.Graphics by Foley/Van Dam, but I don't have this book.
UPDATE: I am looking for how to generate a chroma palette like one on the right:
如果你对这篇内容有疑问,欢迎到本站社区发帖提问 参与讨论,获取更多帮助,或者扫码二维码加入 Web 技术交流群。

绑定邮箱获取回复消息
由于您还没有绑定你的真实邮箱,如果其他用户或者作者回复了您的评论,将不能在第一时间通知您!

发布评论
评论(5)
您可以尝试将值限制为最大值 255 (0xff)。
编辑:有很多不同的方法可以自动转换为颜色,但您可能会发现它们都不能生成您正在寻找的确切进展。由于您已经有了可接受的调色板图片,一种方法是创建 256 种颜色的查找表。
如果查找表太麻烦,您还可以将灰度范围分成不同的子范围,并在每个范围的端点之间进行线性插值。
You could just try clamping the values to a maximum of 255 (0xff).
Edit: There are a lot of different ways to convert to colors automatically, but you might find that none of them generates the exact progression you're looking for. Since you already have a picture of an acceptable palette, one method would be to create a lookup table of 256 colors.
If the lookup table is too much trouble, you could also break the greyscale range into different subranges and do a linear interpolation between the endpoints of each range.
实际上,您可以使用 YUV 颜色模型,因为它基于两个坐标,即 U 和V.
这似乎更适合这项任务。
和YUV-> RGB 转换非常简单。
Actually you could use the YUV color model since it is kind of based on two coordinates, i.e. U and V.
This seems more appropriate for the task.
And YUV -> RGB conversion is pretty straightforward.
您可以将 RGB 转换为 HSL 并增加亮度/对比度。您可以在此页面上找到有关转换和其他有用信息的论坛: http://lodev.org/cgtutor/颜色.html
You can convert RGB to HSL and increase the brightness/contrast. You can find forumlas for the conversions and other useful info on this page: http://lodev.org/cgtutor/color.html
使用不同的颜色空间意味着您可以轻松地将坐标分配给不同的颜色。
YUV 或 YCrCb 可能适合,因为 UV 或 CrCb 尺寸可以被视为“直角”
或 HSL/HSV(如果您的尺寸之一像色调一样环绕)。
Use a different colour-space that means you can easily assign coordinates to different colours.
YUV or YCrCb might suit as the UV or CrCb dimensions could be treated as "at right-angles"
Or HSL/HSV if one of your dimensions wraps around like the hue does.
我相信您想要一个基于有序值的热图。然后你就有了不同类型的热图。解决方案在这里:http://www.andrewnoske.com/wiki/Code_-_heatmaps_and_color_gradients
I believe you want a heatmap based on the ordered values. Then you have different types of heatmaps. Solution here: http://www.andrewnoske.com/wiki/Code_-_heatmaps_and_color_gradients