如何向绘图添加悬停注释

发布于 2024-12-11 19:53:32 字数 213 浏览 1 评论 0原文

我正在使用 matplotlib 制作散点图。散点图上的每个点都与一个命名对象相关联。当我将光标悬停在与该对象关联的散点图上的点上时,我希望能够看到该对象的名称。特别是,如果能够快速查看异常值点的名称,那就太好了。我在此处搜索时找到的最接近的东西是注释命令,但这似乎在绘图上创建了一个固定标签。不幸的是,根据我拥有的点数,如果我标记每个点,散点图将无法读取。有谁知道如何创建仅当光标悬停在该点附近时才出现的标签?

I am using matplotlib to make scatter plots. Each point on the scatter plot is associated with a named object. I would like to be able to see the name of an object when I hover my cursor over the point on the scatter plot associated with that object. In particular, it would be nice to be able to quickly see the names of the points that are outliers. The closest thing I have been able to find while searching here is the annotate command, but that appears to create a fixed label on the plot. Unfortunately, with the number of points that I have, the scatter plot would be unreadable if I labeled each point. Does anyone know of a way to create labels that only appear when the cursor hovers in the vicinity of that point?

如果你对这篇内容有疑问,欢迎到本站社区发帖提问 参与讨论,获取更多帮助,或者扫码二维码加入 Web 技术交流群。

扫码二维码加入Web技术交流群

发布评论

需要 登录 才能够评论, 你可以免费 注册 一个本站的账号。

评论(13

熊抱啵儿 2024-12-18 19:53:32

下面的代码使用散点,并在悬停在散点上时显示注释

import matplotlib.pyplot as plt
import numpy as np; np.random.seed(1)

x = np.random.rand(15)
y = np.random.rand(15)
names = np.array(list("ABCDEFGHIJKLMNO"))
c = np.random.randint(1,5,size=15)

norm = plt.Normalize(1,4)
cmap = plt.cm.RdYlGn

fig,ax = plt.subplots()
sc = plt.scatter(x,y,c=c, s=100, cmap=cmap, norm=norm)

annot = ax.annotate("", xy=(0,0), xytext=(20,20),textcoords="offset points",
                    bbox=dict(boxstyle="round", fc="w"),
                    arrowprops=dict(arrowstyle="->"))
annot.set_visible(False)

def update_annot(ind):
    
    pos = sc.get_offsets()[ind["ind"][0]]
    annot.xy = pos
    text = "{}, {}".format(" ".join(list(map(str,ind["ind"]))), 
                           " ".join([names[n] for n in ind["ind"]]))
    annot.set_text(text)
    annot.get_bbox_patch().set_facecolor(cmap(norm(c[ind["ind"][0]])))
    annot.get_bbox_patch().set_alpha(0.4)
    

def hover(event):
    vis = annot.get_visible()
    if event.inaxes == ax:
        cont, ind = sc.contains(event)
        if cont:
            update_annot(ind)
            annot.set_visible(True)
            fig.canvas.draw_idle()
        else:
            if vis:
                annot.set_visible(False)
                fig.canvas.draw_idle()

fig.canvas.mpl_connect("motion_notify_event", hover)

plt.show()

输入图像描述这里

因为人们还希望将此解决方案用于线图而不是散点图,所以以下将是用于图的相同解决方案(适用)略有不同)。

import matplotlib.pyplot as plt
import numpy as np; np.random.seed(1)

x = np.sort(np.random.rand(15))
y = np.sort(np.random.rand(15))
names = np.array(list("ABCDEFGHIJKLMNO"))

norm = plt.Normalize(1,4)
cmap = plt.cm.RdYlGn

fig,ax = plt.subplots()
line, = plt.plot(x,y, marker="o")

annot = ax.annotate("", xy=(0,0), xytext=(-20,20),textcoords="offset points",
                    bbox=dict(boxstyle="round", fc="w"),
                    arrowprops=dict(arrowstyle="->"))
annot.set_visible(False)

def update_annot(ind):
    x,y = line.get_data()
    annot.xy = (x[ind["ind"][0]], y[ind["ind"][0]])
    text = "{}, {}".format(" ".join(list(map(str,ind["ind"]))), 
                           " ".join([names[n] for n in ind["ind"]]))
    annot.set_text(text)
    annot.get_bbox_patch().set_alpha(0.4)


def hover(event):
    vis = annot.get_visible()
    if event.inaxes == ax:
        cont, ind = line.contains(event)
        if cont:
            update_annot(ind)
            annot.set_visible(True)
            fig.canvas.draw_idle()
        else:
            if vis:
                annot.set_visible(False)
                fig.canvas.draw_idle()

fig.canvas.mpl_connect("motion_notify_event", hover)

plt.show()

如果有人正在寻找双轴线条的解决方案,请参阅 如何在将鼠标悬停在多轴中的某个点上时显示标签?

以防有人正在寻找 bar 的解决方案情节,请参考例如这个答案

Here is a code that uses a scatter and shows an annotation upon hovering over the scatter points.

import matplotlib.pyplot as plt
import numpy as np; np.random.seed(1)

x = np.random.rand(15)
y = np.random.rand(15)
names = np.array(list("ABCDEFGHIJKLMNO"))
c = np.random.randint(1,5,size=15)

norm = plt.Normalize(1,4)
cmap = plt.cm.RdYlGn

fig,ax = plt.subplots()
sc = plt.scatter(x,y,c=c, s=100, cmap=cmap, norm=norm)

annot = ax.annotate("", xy=(0,0), xytext=(20,20),textcoords="offset points",
                    bbox=dict(boxstyle="round", fc="w"),
                    arrowprops=dict(arrowstyle="->"))
annot.set_visible(False)

def update_annot(ind):
    
    pos = sc.get_offsets()[ind["ind"][0]]
    annot.xy = pos
    text = "{}, {}".format(" ".join(list(map(str,ind["ind"]))), 
                           " ".join([names[n] for n in ind["ind"]]))
    annot.set_text(text)
    annot.get_bbox_patch().set_facecolor(cmap(norm(c[ind["ind"][0]])))
    annot.get_bbox_patch().set_alpha(0.4)
    

def hover(event):
    vis = annot.get_visible()
    if event.inaxes == ax:
        cont, ind = sc.contains(event)
        if cont:
            update_annot(ind)
            annot.set_visible(True)
            fig.canvas.draw_idle()
        else:
            if vis:
                annot.set_visible(False)
                fig.canvas.draw_idle()

fig.canvas.mpl_connect("motion_notify_event", hover)

plt.show()

enter image description here

Because people also want to use this solution for a line plot instead of a scatter, the following would be the same solution for plot (which works slightly differently).

import matplotlib.pyplot as plt
import numpy as np; np.random.seed(1)

x = np.sort(np.random.rand(15))
y = np.sort(np.random.rand(15))
names = np.array(list("ABCDEFGHIJKLMNO"))

norm = plt.Normalize(1,4)
cmap = plt.cm.RdYlGn

fig,ax = plt.subplots()
line, = plt.plot(x,y, marker="o")

annot = ax.annotate("", xy=(0,0), xytext=(-20,20),textcoords="offset points",
                    bbox=dict(boxstyle="round", fc="w"),
                    arrowprops=dict(arrowstyle="->"))
annot.set_visible(False)

def update_annot(ind):
    x,y = line.get_data()
    annot.xy = (x[ind["ind"][0]], y[ind["ind"][0]])
    text = "{}, {}".format(" ".join(list(map(str,ind["ind"]))), 
                           " ".join([names[n] for n in ind["ind"]]))
    annot.set_text(text)
    annot.get_bbox_patch().set_alpha(0.4)


def hover(event):
    vis = annot.get_visible()
    if event.inaxes == ax:
        cont, ind = line.contains(event)
        if cont:
            update_annot(ind)
            annot.set_visible(True)
            fig.canvas.draw_idle()
        else:
            if vis:
                annot.set_visible(False)
                fig.canvas.draw_idle()

fig.canvas.mpl_connect("motion_notify_event", hover)

plt.show()

In case someone is looking for a solution for lines in twin axes, refer to How to make labels appear when hovering over a point in multiple axis?

In case someone is looking for a solution for bar plots, please refer to e.g. this answer.

平生欢 2024-12-18 19:53:32

此解决方案在悬停一行时有效,无需单击它:

import matplotlib.pyplot as plt

# Need to create as global variable so our callback(on_plot_hover) can access
fig = plt.figure()
plot = fig.add_subplot(111)

# create some curves
for i in range(4):
    # Giving unique ids to each data member
    plot.plot(
        [i*1,i*2,i*3,i*4],
        gid=i)

def on_plot_hover(event):
    # Iterating over each data member plotted
    for curve in plot.get_lines():
        # Searching which data member corresponds to current mouse position
        if curve.contains(event)[0]:
            print("over %s" % curve.get_gid())
            
fig.canvas.mpl_connect('motion_notify_event', on_plot_hover)           
plt.show()

This solution works when hovering a line without the need to click it:

import matplotlib.pyplot as plt

# Need to create as global variable so our callback(on_plot_hover) can access
fig = plt.figure()
plot = fig.add_subplot(111)

# create some curves
for i in range(4):
    # Giving unique ids to each data member
    plot.plot(
        [i*1,i*2,i*3,i*4],
        gid=i)

def on_plot_hover(event):
    # Iterating over each data member plotted
    for curve in plot.get_lines():
        # Searching which data member corresponds to current mouse position
        if curve.contains(event)[0]:
            print("over %s" % curve.get_gid())
            
fig.canvas.mpl_connect('motion_notify_event', on_plot_hover)           
plt.show()
陌上芳菲 2024-12-18 19:53:32
import matplotlib.pyplot as plt
import pandas_datareader as web  # only for test data; must be installed with conda or pip
from mplcursors import cursor  # separate package must be installed

# reproducible sample data as a pandas dataframe
df = web.DataReader('aapl', data_source='yahoo', start='2021-03-09', end='2022-06-13')

plt.figure(figsize=(12, 7))
plt.plot(df.index, df.Close)
cursor(hover=True)
plt.show()

在此处输入图像描述

熊猫

ax = df.plot(y='Close', figsize=(10, 7))
cursor(hover=True)
plt.show()

在此处输入图像描述

Seaborn

  • 适用于轴级绘图,例如 sns.lineplot,以及图形级绘图,例如 sns.relplot
import seaborn as sns

# load sample data
tips = sns.load_dataset('tips')

sns.relplot(data=tips, x="total_bill", y="tip", hue="day", col="time")
cursor(hover=True)
plt.show()

输入图像描述这里

import matplotlib.pyplot as plt
import pandas_datareader as web  # only for test data; must be installed with conda or pip
from mplcursors import cursor  # separate package must be installed

# reproducible sample data as a pandas dataframe
df = web.DataReader('aapl', data_source='yahoo', start='2021-03-09', end='2022-06-13')

plt.figure(figsize=(12, 7))
plt.plot(df.index, df.Close)
cursor(hover=True)
plt.show()

enter image description here

Pandas

ax = df.plot(y='Close', figsize=(10, 7))
cursor(hover=True)
plt.show()

enter image description here

Seaborn

  • Works with axes-level plots like sns.lineplot, and figure-level plots like sns.relplot.
import seaborn as sns

# load sample data
tips = sns.load_dataset('tips')

sns.relplot(data=tips, x="total_bill", y="tip", hue="day", col="time")
cursor(hover=True)
plt.show()

enter image description here

噩梦成真你也成魔 2024-12-18 19:53:32

来自 http://matplotlib.sourceforge.net/examples/event_handling/pick_event_demo.html :

from matplotlib.pyplot import figure, show
import numpy as npy
from numpy.random import rand


if 1: # picking on a scatter plot (matplotlib.collections.RegularPolyCollection)

    x, y, c, s = rand(4, 100)
    def onpick3(event):
        ind = event.ind
        print('onpick3 scatter:', ind, npy.take(x, ind), npy.take(y, ind))

    fig = figure()
    ax1 = fig.add_subplot(111)
    col = ax1.scatter(x, y, 100*s, c, picker=True)
    #fig.savefig('pscoll.eps')
    fig.canvas.mpl_connect('pick_event', onpick3)

show()

From http://matplotlib.sourceforge.net/examples/event_handling/pick_event_demo.html :

from matplotlib.pyplot import figure, show
import numpy as npy
from numpy.random import rand


if 1: # picking on a scatter plot (matplotlib.collections.RegularPolyCollection)

    x, y, c, s = rand(4, 100)
    def onpick3(event):
        ind = event.ind
        print('onpick3 scatter:', ind, npy.take(x, ind), npy.take(y, ind))

    fig = figure()
    ax1 = fig.add_subplot(111)
    col = ax1.scatter(x, y, 100*s, c, picker=True)
    #fig.savefig('pscoll.eps')
    fig.canvas.mpl_connect('pick_event', onpick3)

show()
゛清羽墨安 2024-12-18 19:53:32

其他答案没有满足我在 Jupyter 内联 matplotlib 图的最新版本中正确显示工具提示的需求。但这是有效的:

import matplotlib.pyplot as plt
import numpy as np
import mplcursors
np.random.seed(42)

fig, ax = plt.subplots()
ax.scatter(*np.random.random((2, 26)))
ax.set_title("Mouse over a point")
crs = mplcursors.cursor(ax,hover=True)

crs.connect("add", lambda sel: sel.annotation.set_text(
    'Point {},{}'.format(sel.target[0], sel.target[1])))
plt.show()

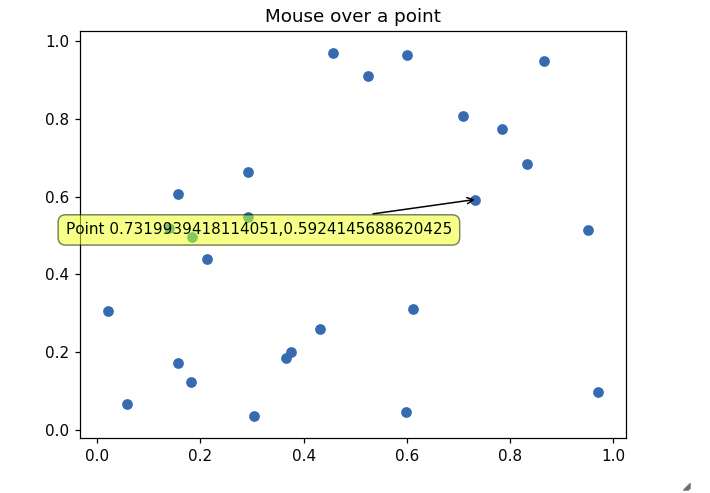
当用鼠标移动到某个点时,会导致如下图所示的结果:
输入图像描述这里

The other answers did not address my need for properly showing tooltips in a recent version of Jupyter inline matplotlib figure. This one works though:

import matplotlib.pyplot as plt
import numpy as np
import mplcursors
np.random.seed(42)

fig, ax = plt.subplots()
ax.scatter(*np.random.random((2, 26)))
ax.set_title("Mouse over a point")
crs = mplcursors.cursor(ax,hover=True)

crs.connect("add", lambda sel: sel.annotation.set_text(
    'Point {},{}'.format(sel.target[0], sel.target[1])))
plt.show()

Leading to something like the following picture when going over a point with mouse:
enter image description here

_畞蕅 2024-12-18 19:53:32

http://matplotlib.org/users/shell.html

import numpy as np
import matplotlib.pyplot as plt

fig = plt.figure()
ax = fig.add_subplot(111)
ax.set_title('click on points')

line, = ax.plot(np.random.rand(100), '-', picker=5)  # 5 points tolerance


def onpick(event):
    thisline = event.artist
    xdata = thisline.get_xdata()
    ydata = thisline.get_ydata()
    ind = event.ind
    print('onpick points:', *zip(xdata[ind], ydata[ind]))


fig.canvas.mpl_connect('pick_event', onpick)

plt.show()

这绘制了一条直线图,正如 Sohaib 所要求的那样

A slight edit on an example provided in http://matplotlib.org/users/shell.html:

import numpy as np
import matplotlib.pyplot as plt

fig = plt.figure()
ax = fig.add_subplot(111)
ax.set_title('click on points')

line, = ax.plot(np.random.rand(100), '-', picker=5)  # 5 points tolerance


def onpick(event):
    thisline = event.artist
    xdata = thisline.get_xdata()
    ydata = thisline.get_ydata()
    ind = event.ind
    print('onpick points:', *zip(xdata[ind], ydata[ind]))


fig.canvas.mpl_connect('pick_event', onpick)

plt.show()

This plots a straight line plot, as Sohaib was asking

丢了幸福的猪 2024-12-18 19:53:32

mplcursors 为我工作。 mplcursors 为 matplotlib 提供可点击的注释。它深受 mpldatacursor (https://github.com/joferkington/mpldatacursor) 的启发,有很多简化的API

import matplotlib.pyplot as plt
import numpy as np
import mplcursors

data = np.outer(range(10), range(1, 5))

fig, ax = plt.subplots()
lines = ax.plot(data)
ax.set_title("Click somewhere on a line.\nRight-click to deselect.\n"
             "Annotations can be dragged.")

mplcursors.cursor(lines) # or just mplcursors.cursor()

plt.show()

mplcursors worked for me. mplcursors provides clickable annotation for matplotlib. It is heavily inspired from mpldatacursor (https://github.com/joferkington/mpldatacursor), with a much simplified API

import matplotlib.pyplot as plt
import numpy as np
import mplcursors

data = np.outer(range(10), range(1, 5))

fig, ax = plt.subplots()
lines = ax.plot(data)
ax.set_title("Click somewhere on a line.\nRight-click to deselect.\n"
             "Annotations can be dragged.")

mplcursors.cursor(lines) # or just mplcursors.cursor()

plt.show()
于我来说 2024-12-18 19:53:32

mpld3 为我解决了这个问题。

import matplotlib.pyplot as plt
import numpy as np
import mpld3

fig, ax = plt.subplots(subplot_kw=dict(axisbg='#EEEEEE'))
N = 100

scatter = ax.scatter(np.random.normal(size=N),
                 np.random.normal(size=N),
                 c=np.random.random(size=N),
                 s=1000 * np.random.random(size=N),
                 alpha=0.3,
                 cmap=plt.cm.jet)
ax.grid(color='white', linestyle='solid')

ax.set_title("Scatter Plot (with tooltips!)", size=20)

labels = ['point {0}'.format(i + 1) for i in range(N)]
tooltip = mpld3.plugins.PointLabelTooltip(scatter, labels=labels)
mpld3.plugins.connect(fig, tooltip)

mpld3.show()

您可以查看以下示例: https://mpld3.github.io/examples/scatter_tooltip.html< /a>

mpld3 solves it for me.

import matplotlib.pyplot as plt
import numpy as np
import mpld3

fig, ax = plt.subplots(subplot_kw=dict(axisbg='#EEEEEE'))
N = 100

scatter = ax.scatter(np.random.normal(size=N),
                 np.random.normal(size=N),
                 c=np.random.random(size=N),
                 s=1000 * np.random.random(size=N),
                 alpha=0.3,
                 cmap=plt.cm.jet)
ax.grid(color='white', linestyle='solid')

ax.set_title("Scatter Plot (with tooltips!)", size=20)

labels = ['point {0}'.format(i + 1) for i in range(N)]
tooltip = mpld3.plugins.PointLabelTooltip(scatter, labels=labels)
mpld3.plugins.connect(fig, tooltip)

mpld3.show()

You can check this example: https://mpld3.github.io/examples/scatter_tooltip.html

ㄟ。诗瑗 2024-12-18 19:53:32

我制作了一个多行注释系统添加到: https://stackoverflow.com/a/47166787/10302020
对于最新版本:
https://github.com/AidenBurgess/MultiAnnotationLineGraph

只需更改底部的数据即可。

import matplotlib.pyplot as plt


def update_annot(ind, line, annot, ydata):
    x, y = line.get_data()
    annot.xy = (x[ind["ind"][0]], y[ind["ind"][0]])
    # Get x and y values, then format them to be displayed
    x_values = " ".join(list(map(str, ind["ind"])))
    y_values = " ".join(str(ydata[n]) for n in ind["ind"])
    text = "{}, {}".format(x_values, y_values)
    annot.set_text(text)
    annot.get_bbox_patch().set_alpha(0.4)


def hover(event, line_info):
    line, annot, ydata = line_info
    vis = annot.get_visible()
    if event.inaxes == ax:
        # Draw annotations if cursor in right position
        cont, ind = line.contains(event)
        if cont:
            update_annot(ind, line, annot, ydata)
            annot.set_visible(True)
            fig.canvas.draw_idle()
        else:
            # Don't draw annotations
            if vis:
                annot.set_visible(False)
                fig.canvas.draw_idle()


def plot_line(x, y):
    line, = plt.plot(x, y, marker="o")
    # Annotation style may be changed here
    annot = ax.annotate("", xy=(0, 0), xytext=(-20, 20), textcoords="offset points",
                        bbox=dict(boxstyle="round", fc="w"),
                        arrowprops=dict(arrowstyle="->"))
    annot.set_visible(False)
    line_info = [line, annot, y]
    fig.canvas.mpl_connect("motion_notify_event",
                           lambda event: hover(event, line_info))


# Your data values to plot
x1 = range(21)
y1 = range(0, 21)
x2 = range(21)
y2 = range(0, 42, 2)
# Plot line graphs
fig, ax = plt.subplots()
plot_line(x1, y1)
plot_line(x2, y2)
plt.show()

I have made a multi-line annotation system to add to: https://stackoverflow.com/a/47166787/10302020.
for the most up to date version:
https://github.com/AidenBurgess/MultiAnnotationLineGraph

Simply change the data in the bottom section.

import matplotlib.pyplot as plt


def update_annot(ind, line, annot, ydata):
    x, y = line.get_data()
    annot.xy = (x[ind["ind"][0]], y[ind["ind"][0]])
    # Get x and y values, then format them to be displayed
    x_values = " ".join(list(map(str, ind["ind"])))
    y_values = " ".join(str(ydata[n]) for n in ind["ind"])
    text = "{}, {}".format(x_values, y_values)
    annot.set_text(text)
    annot.get_bbox_patch().set_alpha(0.4)


def hover(event, line_info):
    line, annot, ydata = line_info
    vis = annot.get_visible()
    if event.inaxes == ax:
        # Draw annotations if cursor in right position
        cont, ind = line.contains(event)
        if cont:
            update_annot(ind, line, annot, ydata)
            annot.set_visible(True)
            fig.canvas.draw_idle()
        else:
            # Don't draw annotations
            if vis:
                annot.set_visible(False)
                fig.canvas.draw_idle()


def plot_line(x, y):
    line, = plt.plot(x, y, marker="o")
    # Annotation style may be changed here
    annot = ax.annotate("", xy=(0, 0), xytext=(-20, 20), textcoords="offset points",
                        bbox=dict(boxstyle="round", fc="w"),
                        arrowprops=dict(arrowstyle="->"))
    annot.set_visible(False)
    line_info = [line, annot, y]
    fig.canvas.mpl_connect("motion_notify_event",
                           lambda event: hover(event, line_info))


# Your data values to plot
x1 = range(21)
y1 = range(0, 21)
x2 = range(21)
y2 = range(0, 42, 2)
# Plot line graphs
fig, ax = plt.subplots()
plot_line(x1, y1)
plot_line(x2, y2)
plt.show()
不念旧人 2024-12-18 19:53:32

在 matplotlib 状态栏中显示对象信息

在此处输入图像描述

特点

  • 无需额外的库
  • 干净的绘图
  • 无标签重叠,艺术家
  • 支持多艺术家标签
  • 可以处理来自不同绘图调用的艺术家(例如 scatterplot, add_patch)
  • 库风格代码中的

代码

### imports
import matplotlib as mpl
import matplotlib.pylab as plt
import numpy as np


# https://stackoverflow.com/a/47166787/7128154
# https://matplotlib.org/3.3.3/api/collections_api.html#matplotlib.collections.PathCollection
# https://matplotlib.org/3.3.3/api/path_api.html#matplotlib.path.Path
# https://stackoverflow.com/questions/15876011/add-information-to-matplotlib-navigation-toolbar-status-bar
# https://stackoverflow.com/questions/36730261/matplotlib-path-contains-point
# https://stackoverflow.com/a/36335048/7128154
class StatusbarHoverManager:
    """
    Manage hover information for mpl.axes.Axes object based on appearing
    artists.

    Attributes
    ----------
    ax : mpl.axes.Axes
        subplot to show status information
    artists : list of mpl.artist.Artist
        elements on the subplot, which react to mouse over
    labels : list (list of strings) or strings
        each element on the top level corresponds to an artist.
        if the artist has items
        (i.e. second return value of contains() has key 'ind'),
        the element has to be of type list.
        otherwise the element if of type string
    cid : to reconnect motion_notify_event
    """
    def __init__(self, ax):
        assert isinstance(ax, mpl.axes.Axes)


        def hover(event):
            if event.inaxes != ax:
                return
            info = 'x={:.2f}, y={:.2f}'.format(event.xdata, event.ydata)
            ax.format_coord = lambda x, y: info
        cid = ax.figure.canvas.mpl_connect("motion_notify_event", hover)

        self.ax = ax
        self.cid = cid
        self.artists = []
        self.labels = []

    def add_artist_labels(self, artist, label):
        if isinstance(artist, list):
            assert len(artist) == 1
            artist = artist[0]

        self.artists += [artist]
        self.labels += [label]

        def hover(event):
            if event.inaxes != self.ax:
                return
            info = 'x={:.2f}, y={:.2f}'.format(event.xdata, event.ydata)
            for aa, artist in enumerate(self.artists):
                cont, dct = artist.contains(event)
                if not cont:
                    continue
                inds = dct.get('ind')
                if inds is not None:  # artist contains items
                    for ii in inds:
                        lbl = self.labels[aa][ii]
                        info += ';   artist [{:d}, {:d}]: {:}'.format(
                            aa, ii, lbl)
                else:
                    lbl = self.labels[aa]
                    info += ';   artist [{:d}]: {:}'.format(aa, lbl)
            self.ax.format_coord = lambda x, y: info

        self.ax.figure.canvas.mpl_disconnect(self.cid)
        self.cid = self.ax.figure.canvas.mpl_connect(
            "motion_notify_event", hover)


def demo_StatusbarHoverManager():
    fig, ax = plt.subplots()
    shm = StatusbarHoverManager(ax)

    poly = mpl.patches.Polygon(
        [[0,0], [3, 5], [5, 4], [6,1]], closed=True, color='green', zorder=0)
    artist = ax.add_patch(poly)
    shm.add_artist_labels(artist, 'polygon')

    artist = ax.scatter([2.5, 1, 2, 3], [6, 1, 1, 7], c='blue', s=10**2)
    lbls = ['point ' + str(ii) for ii in range(4)]
    shm.add_artist_labels(artist, lbls)

    artist = ax.plot(
        [0, 0, 1, 5, 3], [0, 1, 1, 0, 2], marker='o', color='red')
    lbls = ['segment ' + str(ii) for ii in range(5)]
    shm.add_artist_labels(artist, lbls)

    plt.show()


# --- main
if __name__== "__main__":
    demo_StatusbarHoverManager()

showing object information in matplotlib statusbar

enter image description here

Features

  • no extra libraries needed
  • clean plot
  • no overlap of labels and artists
  • supports multi artist labeling
  • can handle artists from different plotting calls (like scatter, plot, add_patch)
  • code in library style

Code

### imports
import matplotlib as mpl
import matplotlib.pylab as plt
import numpy as np


# https://stackoverflow.com/a/47166787/7128154
# https://matplotlib.org/3.3.3/api/collections_api.html#matplotlib.collections.PathCollection
# https://matplotlib.org/3.3.3/api/path_api.html#matplotlib.path.Path
# https://stackoverflow.com/questions/15876011/add-information-to-matplotlib-navigation-toolbar-status-bar
# https://stackoverflow.com/questions/36730261/matplotlib-path-contains-point
# https://stackoverflow.com/a/36335048/7128154
class StatusbarHoverManager:
    """
    Manage hover information for mpl.axes.Axes object based on appearing
    artists.

    Attributes
    ----------
    ax : mpl.axes.Axes
        subplot to show status information
    artists : list of mpl.artist.Artist
        elements on the subplot, which react to mouse over
    labels : list (list of strings) or strings
        each element on the top level corresponds to an artist.
        if the artist has items
        (i.e. second return value of contains() has key 'ind'),
        the element has to be of type list.
        otherwise the element if of type string
    cid : to reconnect motion_notify_event
    """
    def __init__(self, ax):
        assert isinstance(ax, mpl.axes.Axes)


        def hover(event):
            if event.inaxes != ax:
                return
            info = 'x={:.2f}, y={:.2f}'.format(event.xdata, event.ydata)
            ax.format_coord = lambda x, y: info
        cid = ax.figure.canvas.mpl_connect("motion_notify_event", hover)

        self.ax = ax
        self.cid = cid
        self.artists = []
        self.labels = []

    def add_artist_labels(self, artist, label):
        if isinstance(artist, list):
            assert len(artist) == 1
            artist = artist[0]

        self.artists += [artist]
        self.labels += [label]

        def hover(event):
            if event.inaxes != self.ax:
                return
            info = 'x={:.2f}, y={:.2f}'.format(event.xdata, event.ydata)
            for aa, artist in enumerate(self.artists):
                cont, dct = artist.contains(event)
                if not cont:
                    continue
                inds = dct.get('ind')
                if inds is not None:  # artist contains items
                    for ii in inds:
                        lbl = self.labels[aa][ii]
                        info += ';   artist [{:d}, {:d}]: {:}'.format(
                            aa, ii, lbl)
                else:
                    lbl = self.labels[aa]
                    info += ';   artist [{:d}]: {:}'.format(aa, lbl)
            self.ax.format_coord = lambda x, y: info

        self.ax.figure.canvas.mpl_disconnect(self.cid)
        self.cid = self.ax.figure.canvas.mpl_connect(
            "motion_notify_event", hover)


def demo_StatusbarHoverManager():
    fig, ax = plt.subplots()
    shm = StatusbarHoverManager(ax)

    poly = mpl.patches.Polygon(
        [[0,0], [3, 5], [5, 4], [6,1]], closed=True, color='green', zorder=0)
    artist = ax.add_patch(poly)
    shm.add_artist_labels(artist, 'polygon')

    artist = ax.scatter([2.5, 1, 2, 3], [6, 1, 1, 7], c='blue', s=10**2)
    lbls = ['point ' + str(ii) for ii in range(4)]
    shm.add_artist_labels(artist, lbls)

    artist = ax.plot(
        [0, 0, 1, 5, 3], [0, 1, 1, 0, 2], marker='o', color='red')
    lbls = ['segment ' + str(ii) for ii in range(5)]
    shm.add_artist_labels(artist, lbls)

    plt.show()


# --- main
if __name__== "__main__":
    demo_StatusbarHoverManager()
ぇ气 2024-12-18 19:53:32

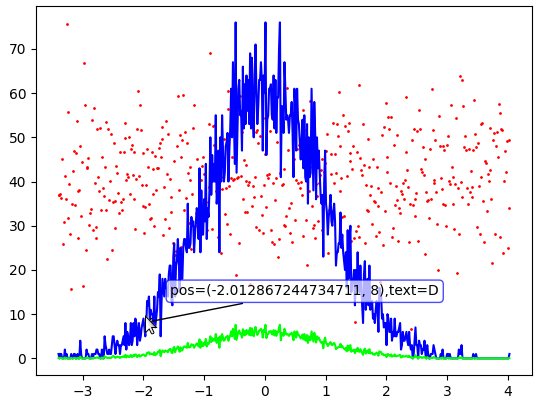
基于 Markus Dutschke”和“ImportanceOfBeingErnest”,我(imo)简化了代码并使其更加模块化。

而且这不需要安装额外的软件包。

import matplotlib.pylab as plt
import numpy as np

plt.close('all')
fh, ax = plt.subplots()

#Generate some data
y,x = np.histogram(np.random.randn(10000), bins=500)
x = x[:-1]
colors = ['#0000ff', '#00ff00','#ff0000']
x2, y2 = x,y/10
x3, y3 = x, np.random.randn(500)*10+40

#Plot
h1 = ax.plot(x, y, color=colors[0])
h2 = ax.plot(x2, y2, color=colors[1])
h3 = ax.scatter(x3, y3, color=colors[2], s=1)

artists = h1 + h2 + [h3] #concatenating lists
labels = [list('ABCDE'*100),list('FGHIJ'*100),list('klmno'*100)] #define labels shown

#___ Initialize annotation arrow
annot = ax.annotate("", xy=(0,0), xytext=(20,20),textcoords="offset points",
                    bbox=dict(boxstyle="round", fc="w"),
                    arrowprops=dict(arrowstyle="->"))
annot.set_visible(False)

def on_plot_hover(event):
    if event.inaxes != ax: #exit if mouse is not on figure
        return
    is_vis = annot.get_visible() #check if an annotation is visible
    # x,y = event.xdata,event.ydata #coordinates of mouse in graph
    for ii, artist in enumerate(artists):
        is_contained, dct = artist.contains(event)

        if(is_contained):
            if('get_data' in dir(artist)): #for plot
                data = list(zip(*artist.get_data()))
            elif('get_offsets' in dir(artist)): #for scatter
                data = artist.get_offsets().data

            inds = dct['ind'] #get which data-index is under the mouse
            #___ Set Annotation settings
            xy = data[inds[0]] #get 1st position only
            annot.xy = xy
            annot.set_text(f'pos={xy},text={labels[ii][inds[0]]}')
            annot.get_bbox_patch().set_edgecolor(colors[ii])
            annot.get_bbox_patch().set_alpha(0.7)
            annot.set_visible(True)
            fh.canvas.draw_idle()
        else:
             if is_vis:
                 annot.set_visible(False) #disable when not hovering
                 fh.canvas.draw_idle()

fh.canvas.mpl_connect('motion_notify_event', on_plot_hover)

给出以下结果:
绘图 2高斯和 1 散点

Based off Markus Dutschke" and "ImportanceOfBeingErnest", I (imo) simplified the code and made it more modular.

Also this doesn't require additional packages to be installed.

import matplotlib.pylab as plt
import numpy as np

plt.close('all')
fh, ax = plt.subplots()

#Generate some data
y,x = np.histogram(np.random.randn(10000), bins=500)
x = x[:-1]
colors = ['#0000ff', '#00ff00','#ff0000']
x2, y2 = x,y/10
x3, y3 = x, np.random.randn(500)*10+40

#Plot
h1 = ax.plot(x, y, color=colors[0])
h2 = ax.plot(x2, y2, color=colors[1])
h3 = ax.scatter(x3, y3, color=colors[2], s=1)

artists = h1 + h2 + [h3] #concatenating lists
labels = [list('ABCDE'*100),list('FGHIJ'*100),list('klmno'*100)] #define labels shown

#___ Initialize annotation arrow
annot = ax.annotate("", xy=(0,0), xytext=(20,20),textcoords="offset points",
                    bbox=dict(boxstyle="round", fc="w"),
                    arrowprops=dict(arrowstyle="->"))
annot.set_visible(False)

def on_plot_hover(event):
    if event.inaxes != ax: #exit if mouse is not on figure
        return
    is_vis = annot.get_visible() #check if an annotation is visible
    # x,y = event.xdata,event.ydata #coordinates of mouse in graph
    for ii, artist in enumerate(artists):
        is_contained, dct = artist.contains(event)

        if(is_contained):
            if('get_data' in dir(artist)): #for plot
                data = list(zip(*artist.get_data()))
            elif('get_offsets' in dir(artist)): #for scatter
                data = artist.get_offsets().data

            inds = dct['ind'] #get which data-index is under the mouse
            #___ Set Annotation settings
            xy = data[inds[0]] #get 1st position only
            annot.xy = xy
            annot.set_text(f'pos={xy},text={labels[ii][inds[0]]}')
            annot.get_bbox_patch().set_edgecolor(colors[ii])
            annot.get_bbox_patch().set_alpha(0.7)
            annot.set_visible(True)
            fh.canvas.draw_idle()
        else:
             if is_vis:
                 annot.set_visible(False) #disable when not hovering
                 fh.canvas.draw_idle()

fh.canvas.mpl_connect('motion_notify_event', on_plot_hover)

Giving the following result:
Plotting 2 gaussians and 1 scatter

陌上青苔 2024-12-18 19:53:32

我已经调整了 ImportanceOfBeingErnest 的答案来使用补丁和类。特点:

  • 整个框架包含在单个类中,因此所有使用的变量仅在其相关范围内可用。
  • 可以创建多个不同的补丁集 将鼠标
  • 悬停在补丁上会打印补丁集合名称和补丁子名称
  • 将鼠标悬停在补丁上,通过将其边缘颜色更改为黑色来突出显示该集合的所有补丁

补丁解决方案示例

注意:对于我的应用程序,重叠是不相关,因此一次仅显示一个对象的名称。如果您愿意,可以随意扩展到多个对象,这并不太难。

使用

fig, ax = plt.subplots(tight_layout=True)

ap = annotated_patches(fig, ax)
ap.add_patches('Azure', 'circle', 'blue', np.random.uniform(0, 1, (4,2)), 'ABCD', 0.1)
ap.add_patches('Lava', 'rect', 'red', np.random.uniform(0, 1, (3,2)), 'EFG', 0.1, 0.05)
ap.add_patches('Emerald', 'rect', 'green', np.random.uniform(0, 1, (3,2)), 'HIJ', 0.05, 0.1)

plt.axis('equal')
plt.axis('off')

plt.show()

实现

import numpy as np
import matplotlib.pyplot as plt
import matplotlib.patches as mpatches
from matplotlib.collections import PatchCollection

np.random.seed(1)


class annotated_patches:
    def __init__(self, fig, ax):
        self.fig = fig
        self.ax = ax

        self.annot = self.ax.annotate("", xy=(0,0),
                            xytext=(20,20),
                            textcoords="offset points",
                            bbox=dict(boxstyle="round", fc="w"),
                            arrowprops=dict(arrowstyle="->"))
        
        self.annot.set_visible(False)
        
        self.collectionsDict = {}
        self.coordsDict = {}
        self.namesDict = {}
        self.isActiveDict = {}

        self.motionCallbackID = self.fig.canvas.mpl_connect("motion_notify_event", self.hover)

    def add_patches(self, groupName, kind, color, xyCoords, names, *params):
        if kind=='circle':
            circles = [mpatches.Circle(xy, *params, ec="none") for xy in xyCoords]
            thisCollection = PatchCollection(circles, facecolor=color, alpha=0.5, edgecolor=None)
            ax.add_collection(thisCollection)
        elif kind == 'rect':
            rectangles = [mpatches.Rectangle(xy, *params, ec="none") for xy in xyCoords] 
            thisCollection = PatchCollection(rectangles, facecolor=color, alpha=0.5, edgecolor=None)
            ax.add_collection(thisCollection)
        else:
            raise ValueError('Unexpected kind', kind)
            
        self.collectionsDict[groupName] = thisCollection
        self.coordsDict[groupName] = xyCoords
        self.namesDict[groupName] = names
        self.isActiveDict[groupName] = False
        
    def update_annot(self, groupName, patchIdxs):
        self.annot.xy = self.coordsDict[groupName][patchIdxs[0]]
        self.annot.set_text(groupName + ': ' + self.namesDict[groupName][patchIdxs[0]])
        
        # Set edge color
        self.collectionsDict[groupName].set_edgecolor('black')
        self.isActiveDict[groupName] = True

    def hover(self, event):
        vis = self.annot.get_visible()
        updatedAny = False
        if event.inaxes == self.ax:            
            for groupName, collection in self.collectionsDict.items():
                cont, ind = collection.contains(event)
                if cont:
                    self.update_annot(groupName, ind["ind"])
                    self.annot.set_visible(True)
                    self.fig.canvas.draw_idle()
                    updatedAny = True
                else:
                    if self.isActiveDict[groupName]:
                        collection.set_edgecolor(None)
                        self.isActiveDict[groupName] = True
                    
            if (not updatedAny) and vis:
                self.annot.set_visible(False)
                self.fig.canvas.draw_idle()

I have adapted ImportanceOfBeingErnest's answer to work with patches and classes. Features:

  • The entire framework is contained inside of a single class, so all of the used variables are only available within their relevant scopes.
  • Can create multiple distinct sets of patches
  • Hovering over a patch prints patch collection name and patch subname
  • Hovering over a patch highlights all patches of that collection by changing their edge color to black

Patches solution example

Note: For my applications, the overlap is not relevant, thus only one object's name is displayed at a time. Feel free to extend to multiple objects if you wish, it is not too hard.

Usage

fig, ax = plt.subplots(tight_layout=True)

ap = annotated_patches(fig, ax)
ap.add_patches('Azure', 'circle', 'blue', np.random.uniform(0, 1, (4,2)), 'ABCD', 0.1)
ap.add_patches('Lava', 'rect', 'red', np.random.uniform(0, 1, (3,2)), 'EFG', 0.1, 0.05)
ap.add_patches('Emerald', 'rect', 'green', np.random.uniform(0, 1, (3,2)), 'HIJ', 0.05, 0.1)

plt.axis('equal')
plt.axis('off')

plt.show()

Implementation

import numpy as np
import matplotlib.pyplot as plt
import matplotlib.patches as mpatches
from matplotlib.collections import PatchCollection

np.random.seed(1)


class annotated_patches:
    def __init__(self, fig, ax):
        self.fig = fig
        self.ax = ax

        self.annot = self.ax.annotate("", xy=(0,0),
                            xytext=(20,20),
                            textcoords="offset points",
                            bbox=dict(boxstyle="round", fc="w"),
                            arrowprops=dict(arrowstyle="->"))
        
        self.annot.set_visible(False)
        
        self.collectionsDict = {}
        self.coordsDict = {}
        self.namesDict = {}
        self.isActiveDict = {}

        self.motionCallbackID = self.fig.canvas.mpl_connect("motion_notify_event", self.hover)

    def add_patches(self, groupName, kind, color, xyCoords, names, *params):
        if kind=='circle':
            circles = [mpatches.Circle(xy, *params, ec="none") for xy in xyCoords]
            thisCollection = PatchCollection(circles, facecolor=color, alpha=0.5, edgecolor=None)
            ax.add_collection(thisCollection)
        elif kind == 'rect':
            rectangles = [mpatches.Rectangle(xy, *params, ec="none") for xy in xyCoords] 
            thisCollection = PatchCollection(rectangles, facecolor=color, alpha=0.5, edgecolor=None)
            ax.add_collection(thisCollection)
        else:
            raise ValueError('Unexpected kind', kind)
            
        self.collectionsDict[groupName] = thisCollection
        self.coordsDict[groupName] = xyCoords
        self.namesDict[groupName] = names
        self.isActiveDict[groupName] = False
        
    def update_annot(self, groupName, patchIdxs):
        self.annot.xy = self.coordsDict[groupName][patchIdxs[0]]
        self.annot.set_text(groupName + ': ' + self.namesDict[groupName][patchIdxs[0]])
        
        # Set edge color
        self.collectionsDict[groupName].set_edgecolor('black')
        self.isActiveDict[groupName] = True

    def hover(self, event):
        vis = self.annot.get_visible()
        updatedAny = False
        if event.inaxes == self.ax:            
            for groupName, collection in self.collectionsDict.items():
                cont, ind = collection.contains(event)
                if cont:
                    self.update_annot(groupName, ind["ind"])
                    self.annot.set_visible(True)
                    self.fig.canvas.draw_idle()
                    updatedAny = True
                else:
                    if self.isActiveDict[groupName]:
                        collection.set_edgecolor(None)
                        self.isActiveDict[groupName] = True
                    
            if (not updatedAny) and vis:
                self.annot.set_visible(False)
                self.fig.canvas.draw_idle()
荒芜了季节 2024-12-18 19:53:32

另一种选择是使用 Plotly,它非常直观且易于使用,并且具有能够将具有悬停行为的绘图保存为 html 文件的巨大优势。

绘图悬停名称结果

import plotly.express as px

fig = px.scatter(
            x=[0, 1, 2, 3, 4], 
            y=[0, 1, 4, 9, 16],
            hover_name=['zero', 'one', 'foo', 'bar', 'baz']
)
fig.show()
fig.write_html('scatter_plot_with_hover.html')

下面是一些直观的例子:
https://plotly.com/python/line-and-scatter/

并且这是详细的文档: https://plotly.com/python-api-reference/ generated/plotly.express.scatter.html

Yet another alternative is to use Plotly which is really intuitive and easy to use and has the great advantage of being able to save your plot with the hovering behavior as an html file.

plotly with hovering name result

import plotly.express as px

fig = px.scatter(
            x=[0, 1, 2, 3, 4], 
            y=[0, 1, 4, 9, 16],
            hover_name=['zero', 'one', 'foo', 'bar', 'baz']
)
fig.show()
fig.write_html('scatter_plot_with_hover.html')

Here are some intuitive examples:
https://plotly.com/python/line-and-scatter/

And here is the detailed documentation: https://plotly.com/python-api-reference/generated/plotly.express.scatter.html

~没有更多了~
我们使用 Cookies 和其他技术来定制您的体验包括您的登录状态等。通过阅读我们的 隐私政策 了解更多相关信息。 单击 接受 或继续使用网站,即表示您同意使用 Cookies 和您的相关数据。
原文