在 Python 中创建条形图
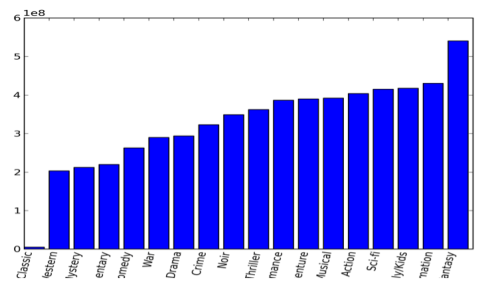
我尝试用 python 创建条形图时遇到一些问题。我的图表代码如下所示:
import matplotlib
matplotlib.use('Agg')
from pylab import *
import calendar

def webshow(img):
    savefig(img,dpi=500)
    print 'Content-Type: text/html\n'
    print '<img width="800" height="400" src="'+img+'" />'

genres = []
n = 0
for c in sorted_list:
    genres.append(sorted_list[n][0])
    n += 1

grosses = []
a = 0
for c in sorted_list:
    grosses.append(sorted_list[a][1])
    a += 1

clf()
bar(arange(len(grosses)),grosses)
xticks( arange(len(genres)),genres, rotation=80)
webshow("barchart.png")
我的图表如下所示:

(来源:tumblr.com)
基本上是我的主要问题是这些值是带科学记数法的小数。如果可能的话,我想以数百万的数量展示它们。另外,我不知道如何制作,这样流派就不会在底部被切断。感谢您的帮助!
I have a couple of problems with the Bar Chart that I'm trying to create in python. My code for the chart looks like this:
import matplotlib
matplotlib.use('Agg')
from pylab import *
import calendar

def webshow(img):
    savefig(img,dpi=500)
    print 'Content-Type: text/html\n'
    print '<img width="800" height="400" src="'+img+'" />'

genres = []
n = 0
for c in sorted_list:
    genres.append(sorted_list[n][0])
    n += 1

grosses = []
a = 0
for c in sorted_list:
    grosses.append(sorted_list[a][1])
    a += 1

clf()
bar(arange(len(grosses)),grosses)
xticks( arange(len(genres)),genres, rotation=80)
webshow("barchart.png")
My chart looks like this:

(source: tumblr.com)
Basically my main problem is that the values are in decimals with scientific notation. I want to present them in millions if possible. Also, I'm not sure how to make it so the genres are not cut off at the bottom. Thank you for any help!
如果你对这篇内容有疑问,欢迎到本站社区发帖提问 参与讨论,获取更多帮助,或者扫码二维码加入 Web 技术交流群。

绑定邮箱获取回复消息
由于您还没有绑定你的真实邮箱,如果其他用户或者作者回复了您的评论,将不能在第一时间通知您!

发布评论
评论(1)
首先,我将使用
figure对象来处理:这使得更容易根据您的喜好构建绘图。要构建图表,应执行以下操作:以及以下注释:
ight_layout函数会自动为您执行此操作。另一种方法是根据所有轴标签的边界框自行计算所需的大小,如下所示 此处,但您需要一个渲染器才能确定所有标签的大小。sci或plain),您可以更改值的呈现。当使用plain时,它只会按原样呈现值。有关详细信息,请参阅有关此函数的文档。请注意,您还可以使用set_yticklabels函数的text参数进一步控制格式(当然该函数也可用于 x 轴。First up, I would use a
figureobject to work on: this makes it easier to construct the plot to your liking. To construct your graph, the following should do:Along with the following remarks:
tight_layoutfunction to do this automatically for you. The alternative is to calculate the needed size by yourself based on the bounding boxes of all axes labels as shown here, but you need a renderer for this to be able to determine the sizes of all labels.sciorplain), you can change the rendering of the values. When usingplain, it will just render the value as is. See the docs on this function for more info. Note that you can also use theset_yticklabelsfunction'stextargument to control the formatting further (of course that function is also available for the x axis.