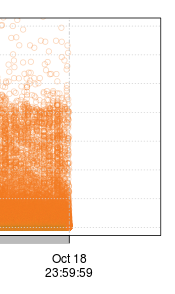
默认 XTS 图的内部图边距
当绘制没有任何自定义 par 属性的 XTS 对象时,我在绘图框(或“绘图区域”)内得到一个边距 离开 http://research.stowers-institute.org/efg/R/Graphics/Basics/mar-oma/index.htm):

(由于白底白字,很难看到,但绘图框(带有黑色实线的框)和边缘之间可能还有 20px 左右的距离这 图像)。
如何调整绘图框中的边距?
When plotting an XTS object without any custom par attributes, I get a margin within the plot box (or "plot area" going off of http://research.stowers-institute.org/efg/R/Graphics/Basics/mar-oma/index.htm):

(It is hard to see due to white on white, but there is another maybe 20px or so between plot box (the box with the solid black line) and the edge of the image).
How can I adjust the margin within the plot box?
如果你对这篇内容有疑问,欢迎到本站社区发帖提问 参与讨论,获取更多帮助,或者扫码二维码加入 Web 技术交流群。

绑定邮箱获取回复消息
由于您还没有绑定你的真实邮箱,如果其他用户或者作者回复了您的评论,将不能在第一时间通知您!


发布评论
评论(1)
您可以通过在调用
plot()或plot.xts()时设置yaxs="i"来解决此问题yaxs< /code> 和xaxs指定用于计算绘制轴范围的方法。yaxs="r"(默认值)是将轴延伸到超出最小和最大 y 值。yaxs="i"绘制的轴仅覆盖数据范围(或提供的ylim值),没有额外的缓冲区。它并不漂亮,但这个示例将向您展示差异:
如果您想更好地控制绘制的范围,您可能需要将
yaxs="i"与ylim=extendrange 结合使用(范围(y值))。You could fix this by setting
yaxs="i"in your call toplot()orplot.xts()yaxsandxaxsspecify the methods used to calculate the extent of the plotted axes.yaxs="r"(the default) is to extend the axis a bit beyond your minimum and maximum y-values.yaxs="i"plots axes that just cover the range of your data (or the supplied value ofylim) with no additional buffer.It's not pretty, but this example will show you the difference:
If you want even finer control over the range plotted, you might want to use
yaxs="i"in combination withylim=extendrange(range(yvalues)).