Mathematica 中对数图刻度线的指数形式

发布于 2024-12-11 12:02:52 字数 523 浏览 1 评论 0原文

为了了解更多 Mathematica,我尝试重现此 上的刻度线对数(对数)图在此处输入图像描述

这是我所能得到的最接近的结果:

LogLogPlot[Log[x!], {x, 1, 10^5}, PlotRange -> {{0, 10^5}, {10^-1, 10^6}}, Ticks -> {Table[10^i, {i, 0, 5}], Table[10^i, {i, -1, 6}]}]

在此处输入图像描述

问题

如何为适当的 n 值制作始终为 10^n 形式的刻度线?

In an attempt to learn more Mathematica, I am trying to reproduce the tick marks on this log (log) plot:
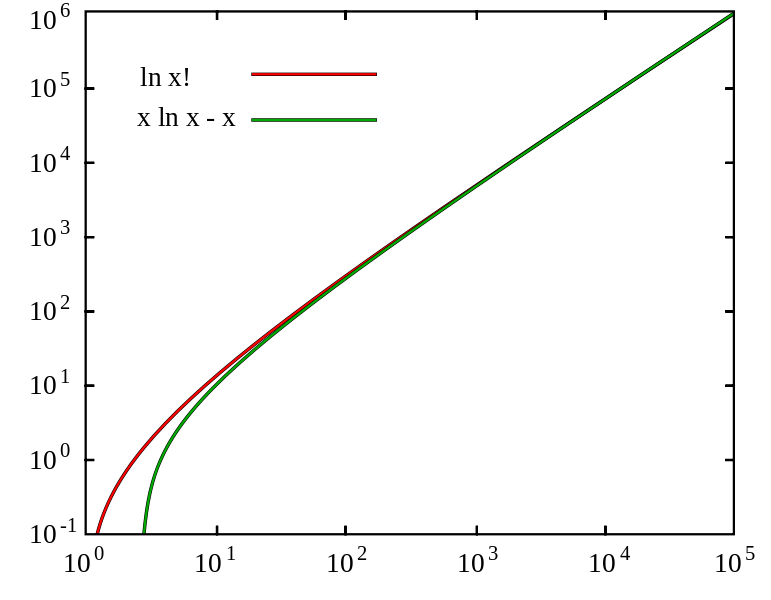
enter image description here

This is as close as I can get:

LogLogPlot[Log[x!], {x, 1, 10^5}, PlotRange -> {{0, 10^5}, {10^-1, 10^6}}, Ticks -> {Table[10^i, {i, 0, 5}], Table[10^i, {i, -1, 6}]}]
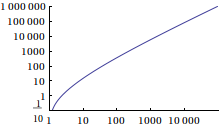
enter image description here

Question

How can I make tick marks that are always of the form 10^n for appropriate values of n?

如果你对这篇内容有疑问,欢迎到本站社区发帖提问 参与讨论,获取更多帮助,或者扫码二维码加入 Web 技术交流群。

扫码二维码加入Web技术交流群

发布评论

需要 登录 才能够评论, 你可以免费 注册 一个本站的账号。

评论(4

天邊彩虹 2024-12-18 12:02:52

Superscript,没有任何内置含义的通用排版形式,是您的朋友。

LogLogPlot[Log[x!], {x, 1, 10^5}, 
   PlotRange -> {{0, 10^5}, {10^-1, 10^6}}, 
   Ticks -> {
       Table[{10^i, Superscript[10, i]}, {i, 0, 5}], 
       Table[{10^i, Superscript[10, i]}, {i, -1, 6}]
       }
   ]

Superscript, the generic typesetting form without any built-in meaning, is your friend for this.

LogLogPlot[Log[x!], {x, 1, 10^5}, 
   PlotRange -> {{0, 10^5}, {10^-1, 10^6}}, 
   Ticks -> {
       Table[{10^i, Superscript[10, i]}, {i, 0, 5}], 
       Table[{10^i, Superscript[10, i]}, {i, -1, 6}]
       }
   ]
梦在夏天 2024-12-18 12:02:52

要扩展前面的答案,您可以通过执行以下操作自动计算 Ticks 选项中 Table 的正确范围

ticksfun[xmin_, xmax_] := 
 Table[{10^i, Superscript[10, i]}, {i, Floor[Log10[xmin]], 
   Ceiling[Log10[xmax]]}]

LogLogPlot[Log[x!], {x, 1, 10^5}, 
 PlotRange -> {{0, 10^5}, {10^-1, 10^6}}, 
 Ticks -> {ticksfun, ticksfun}]

To expand on the previous answers, you can calculate the right range for the Tables in the Ticks option automatically by doing something like

ticksfun[xmin_, xmax_] := 
 Table[{10^i, Superscript[10, i]}, {i, Floor[Log10[xmin]], 
   Ceiling[Log10[xmax]]}]

LogLogPlot[Log[x!], {x, 1, 10^5}, 
 PlotRange -> {{0, 10^5}, {10^-1, 10^6}}, 
 Ticks -> {ticksfun, ticksfun}]
你的往事 2024-12-18 12:02:52

LevelScheme 是 Mathematica 的一个包,它使得制作此类图非常容易简单、完全可定制且外观专业。我非常确定,如果您的绘图是在 mathematica 中制作的,那么它是使用 LevelScheme 的。这是我使用 LevelScheme 在 Mathematica 中复制的图

<<LevelScheme`;
Figure[{
    FigurePanel[{{0,1},{0,1}},
            PlotRange->{{0,5},{-1,6}},
            FrameTicks->{
                        LogTicks[0,5,ShowMinorTicks->False],
                        LogTicks[-1,6,ShowMinorTicks->False]
                    }
    ],
    RawGraphics[
        LogLogPlot[{Log[x!],x Log[x]-x},{x,1,10^5},
                PlotRange->{{0,10^5},{10^-1,10^6}},
                PlotStyle->Darker/@{Red,Green}
            ]
    ]
}, PlotRange->{{-0.1,1.04},{-0.05,1.025}},ImageSize->300{1,1}]

在此处输入图像描述

LevelScheme is a package for Mathematica that makes making such plots very easy, fully customizable and professional looking. I'm very certain that if your plot was made in mathematica, it was using LevelScheme. Here's my reproduction of your plot in Mathematica using LevelScheme

<<LevelScheme`;
Figure[{
    FigurePanel[{{0,1},{0,1}},
            PlotRange->{{0,5},{-1,6}},
            FrameTicks->{
                        LogTicks[0,5,ShowMinorTicks->False],
                        LogTicks[-1,6,ShowMinorTicks->False]
                    }
    ],
    RawGraphics[
        LogLogPlot[{Log[x!],x Log[x]-x},{x,1,10^5},
                PlotRange->{{0,10^5},{10^-1,10^6}},
                PlotStyle->Darker/@{Red,Green}
            ]
    ]
}, PlotRange->{{-0.1,1.04},{-0.05,1.025}},ImageSize->300{1,1}]

enter image description here

花辞树 2024-12-18 12:02:52

您可以通过提供 {value, label} 的 2 元组来指定给定刻度的标签,而不是仅提供 value

这仍然给我们留下了如何维护 10^n 形式的难题。
为此,我们观察到使用 Defer使 10^i 保留其形式。但是,我们仍然需要评估i 在里面,否则我们只会得到一堆 10^i-标签。

示例:

In[19]:= Table[10^i, {i, 0, 6}]

Out[19]= {1, 10, 100, 1000, 10000, 100000, 1000000}

In[18]:= Table[10^Defer[i], {i, 0, 6}]

Out[18]= {10^i, 10^i, 10^i, 10^i, 10^i, 10^i, 10^i}

In[17]:= Table[10^Defer[Evaluate[i]], {i, 0, 6}]

Out[17]= {10^0, 10^1, 10^2, 10^3, 10^4, 10^5, 10^6}

使用这个,我们现在可以执行以下操作来获得解决方案:

LogLogPlot[Log[x!], {x, 1, 10^5}, 
 PlotRange -> {{0, 10^5}, {10^-1, 10^6}}, 
 Ticks -> {Table[{10^i, 10^Defer[Evaluate [i]]}, {i, 0, 5}], 
   Table[{10^i, 10^Defer[Evaluate [i]]}, {i, -1, 6}]}, 
 TicksStyle -> StandardForm]

You can specify the label for a given tick, by giving a 2-tuple of {value, label} instead of giving just giving a value.

This still leaves us with the conundrum of how to maintain the 10^n-form.
To do this, we observe, that using Defer makes the 10^i retain its form. However, we still need to Evaluate the i inside of it, as otherwise we just get a bunch of 10^i-labels.

Example:

In[19]:= Table[10^i, {i, 0, 6}]

Out[19]= {1, 10, 100, 1000, 10000, 100000, 1000000}

In[18]:= Table[10^Defer[i], {i, 0, 6}]

Out[18]= {10^i, 10^i, 10^i, 10^i, 10^i, 10^i, 10^i}

In[17]:= Table[10^Defer[Evaluate[i]], {i, 0, 6}]

Out[17]= {10^0, 10^1, 10^2, 10^3, 10^4, 10^5, 10^6}

Using this, we can now do the following to get a solution:

LogLogPlot[Log[x!], {x, 1, 10^5}, 
 PlotRange -> {{0, 10^5}, {10^-1, 10^6}}, 
 Ticks -> {Table[{10^i, 10^Defer[Evaluate [i]]}, {i, 0, 5}], 
   Table[{10^i, 10^Defer[Evaluate [i]]}, {i, -1, 6}]}, 
 TicksStyle -> StandardForm]
~没有更多了~
我们使用 Cookies 和其他技术来定制您的体验包括您的登录状态等。通过阅读我们的 隐私政策 了解更多相关信息。 单击 接受 或继续使用网站,即表示您同意使用 Cookies 和您的相关数据。
原文