绘制回归曲面
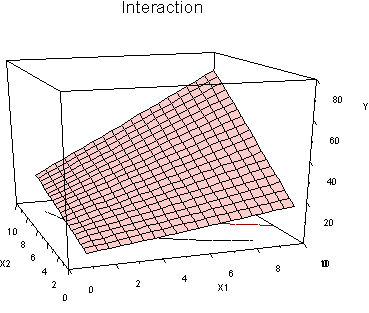
我正在阅读 Cohen、Cohen、Aiken 和 West (2003) 的书“Applied Multiple Regression Correlation Analysis for the Behavioural Sciences”,并且遇到了显示交互和无交互的回归曲面 3D 图(第 259 页)。这些图表看起来像是使用 R 创建的。我喜欢将这些图表作为教学工具,并希望重现它们。这些图看起来像这样: 
Coehn 等人的唯一补充。绘图是 x2 的平均值、+1sd 和 =1sd 处穿过平面的线。如果可能的话,这将是一个很好的补充(通常大多数事情都可以用 R 实现)
我在下面提供了一个示例数据集,其中包含一个 IV、2 个预测变量和中心预测变量。我将如何使用 R 生成回归曲面(平面)图,显示中心数据和非中心数据的交互作用和加法模型(我假设该技术是相同的,但想确保)。
总共 4 个地块: 1. 不居中,无交互作用 2.非中心交互 3.居中无交互 4. 集中互动
DF<-structure(list(y = c(-1.22, -1.73, -2.64, -2.44, -1.11, 2.24,
3.42, 0.67, 0.59, -0.61, -10.77, 0.93, -8.6, -6.99, -0.12, -2.29,
-5.16, -3.35, -3.35, -2.51, 2.21, -1.18, -5.21, -7.74, -1.34),
    x1 = c(39.5, 41, 34, 30.5, 31.5, 30, 41.5, 24, 43, 39, 25.5,
    38.5, 33.5, 30, 41, 31, 25, 37, 37.5, 24.5, 38, 37, 41, 37,
    36), x2 = c(61L, 53L, 53L, 44L, 49L, 44L, 57L, 47L, 54L,
    48L, 46L, 59L, 46L, 61L, 55L, 57L, 59L, 59L, 55L, 50L, 62L,
    55L, 55L, 52L, 55L), centered.x1 = c(5.49702380952381, 6.99702380952381,
    -0.0029761904761898, -3.50297619047619, -2.50297619047619,
    -4.00297619047619, 7.49702380952381, -10.0029761904762, 8.99702380952381,
    4.99702380952381, -8.50297619047619, 4.49702380952381, -0.50297619047619,
    -4.00297619047619, 6.99702380952381, -3.00297619047619, -9.00297619047619,
    2.99702380952381, 3.49702380952381, -9.50297619047619, 3.99702380952381,
    2.99702380952381, 6.99702380952381, 2.99702380952381, 1.99702380952381
    ), centered.x2 = c(9.80357142857143, 1.80357142857143, 1.80357142857143,
    -7.19642857142857, -2.19642857142857, -7.19642857142857,
    5.80357142857143, -4.19642857142857, 2.80357142857143, -3.19642857142857,
    -5.19642857142857, 7.80357142857143, -5.19642857142857, 9.80357142857143,
    3.80357142857143, 5.80357142857143, 7.80357142857143, 7.80357142857143,
    3.80357142857143, -1.19642857142857, 10.8035714285714, 3.80357142857143,
    3.80357142857143, 0.803571428571431, 3.80357142857143)), .Names = c("y",
"x1", "x2", "centered.x1", "centered.x2"), row.names = c(NA,
25L), class = "data.frame")
提前谢谢您。
编辑:以下代码绘制了平面,但当您进行交互时将不起作用(这确实是我感兴趣的)。此外,我也不知道如何绘制 x2 的高值 (+1sd)、低值 (-1sd) 和平均值。
x11(10,5)
 s3d <- scatterplot3d(DF[,c(2,3,1)], type="n", highlight.3d=TRUE,
      angle=70, scale.y=1, pch=16, main="scatterplot3d")

   # Now adding a regression plane to the "scatterplot3d"
    my.lm <-  with(DF, lm(y ~ x1 + x2))
 s3d$plane3d(my.lm, lty.box = "solid")
尝试绘制交互平面(参见此处):
s3d <- scatterplot3d(DF[,c(2,3,1)], type="n", highlight.3d=TRUE,
      angle=70, scale.y=1, pch=16, main="scatterplot3d")

    my.lm <-  with(DF, lm(y ~ x1 + x2 + x1:x2 ))
 s3d$plane3d(my.lm, lty.box = "solid")
产生以下错误:
Error in segments(x, z1, x + y.max * yx.f, z2 + yz.f * y.max, lty = ltya,  :
  cannot mix zero-length and non-zero-length coordinates
I am reading a book by Cohen, Cohen, Aiken and West(2003) "Applied Multiple Regression Correlation Analysis for the Behavioral Sciences" and have come across a 3d plot of a Regression surface showing interaction and no interaction (p. 259). The graphs look like they may have been created using R. I like the graphs as a teaching tool and would like to reproduce them. The plots look something like this:
The only addition to the Coehn et al. plots were lines across the planes at the mean, +1sd, and =1sd for x2. This would be an excellent addition if possible (generally most things are possible with R)
I have provided a sample data set below with an IV, 2 predictors and centered predictors. How would I use R to generate the regression surface (plane) plot showing interaction and an additive model for both the centered and uncentered data (I assume the technique will be the same but want to make sure).
Total of 4 plots:
1. uncentered no interaction
2. uncentered interaction
3. centered no interaction
4. centered interaction
DF<-structure(list(y = c(-1.22, -1.73, -2.64, -2.44, -1.11, 2.24,
3.42, 0.67, 0.59, -0.61, -10.77, 0.93, -8.6, -6.99, -0.12, -2.29,
-5.16, -3.35, -3.35, -2.51, 2.21, -1.18, -5.21, -7.74, -1.34),
    x1 = c(39.5, 41, 34, 30.5, 31.5, 30, 41.5, 24, 43, 39, 25.5,
    38.5, 33.5, 30, 41, 31, 25, 37, 37.5, 24.5, 38, 37, 41, 37,
    36), x2 = c(61L, 53L, 53L, 44L, 49L, 44L, 57L, 47L, 54L,
    48L, 46L, 59L, 46L, 61L, 55L, 57L, 59L, 59L, 55L, 50L, 62L,
    55L, 55L, 52L, 55L), centered.x1 = c(5.49702380952381, 6.99702380952381,
    -0.0029761904761898, -3.50297619047619, -2.50297619047619,
    -4.00297619047619, 7.49702380952381, -10.0029761904762, 8.99702380952381,
    4.99702380952381, -8.50297619047619, 4.49702380952381, -0.50297619047619,
    -4.00297619047619, 6.99702380952381, -3.00297619047619, -9.00297619047619,
    2.99702380952381, 3.49702380952381, -9.50297619047619, 3.99702380952381,
    2.99702380952381, 6.99702380952381, 2.99702380952381, 1.99702380952381
    ), centered.x2 = c(9.80357142857143, 1.80357142857143, 1.80357142857143,
    -7.19642857142857, -2.19642857142857, -7.19642857142857,
    5.80357142857143, -4.19642857142857, 2.80357142857143, -3.19642857142857,
    -5.19642857142857, 7.80357142857143, -5.19642857142857, 9.80357142857143,
    3.80357142857143, 5.80357142857143, 7.80357142857143, 7.80357142857143,
    3.80357142857143, -1.19642857142857, 10.8035714285714, 3.80357142857143,
    3.80357142857143, 0.803571428571431, 3.80357142857143)), .Names = c("y",
"x1", "x2", "centered.x1", "centered.x2"), row.names = c(NA,
25L), class = "data.frame")
Thank you in advance.
EDIT: The following code plots the plane but will not work for when you have an interaction (which is really what I'm interested in). Additionally, I don't know how to plot the high (+1sd), low(-1sd) and mean for x2 either.
x11(10,5)
 s3d <- scatterplot3d(DF[,c(2,3,1)], type="n", highlight.3d=TRUE,
      angle=70, scale.y=1, pch=16, main="scatterplot3d")

   # Now adding a regression plane to the "scatterplot3d"
    my.lm <-  with(DF, lm(y ~ x1 + x2))
 s3d$plane3d(my.lm, lty.box = "solid")
An attempt to plot an interaction plane (Seen here):
s3d <- scatterplot3d(DF[,c(2,3,1)], type="n", highlight.3d=TRUE,
      angle=70, scale.y=1, pch=16, main="scatterplot3d")

    my.lm <-  with(DF, lm(y ~ x1 + x2 + x1:x2 ))
 s3d$plane3d(my.lm, lty.box = "solid")
Yielded the following error:
Error in segments(x, z1, x + y.max * yx.f, z2 + yz.f * y.max, lty = ltya,  :
  cannot mix zero-length and non-zero-length coordinates
如果你对这篇内容有疑问,欢迎到本站社区发帖提问 参与讨论,获取更多帮助,或者扫码二维码加入 Web 技术交流群。

绑定邮箱获取回复消息
由于您还没有绑定你的真实邮箱,如果其他用户或者作者回复了您的评论,将不能在第一时间通知您!

发布评论
评论(1)
以下是我如何使用包“rms”和“lattice”来做到这一点(添加一点颜色):
非交互模型:
Here's how I would do it (adding a bit of color) with packages 'rms' and 'lattice':
And the non-interaction model: