使用 pchart 在一张图像中显示两个图表
我正在努力在同一张图像中生成两个图表。我现在遇到的问题是,当我使用我的方法时,我得到了一些不好的结果。正如您从输出图片中看到的那样,我在第一个图表上得到了两个垂直轴。我只需要第二个图表上的两个垂直轴。
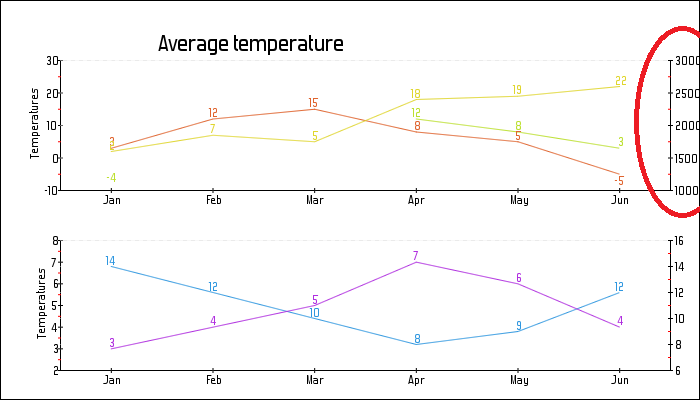
我认为我的代码很糟糕,或者我的方法很糟糕。如何使用 pcharts 将两个图表生成到同一张图像中。仅当我需要在同一图像上有两个垂直轴和多个图表时,才会出现此问题。
和我的代码:
<?php
 include("../pchart/class/pData.class.php");
 include("../pchart/class/pDraw.class.php");
 include("../pchart/class/pImage.class.php");

 $MyData = new pData();
 $MyData->addPoints(array(-4,VOID,VOID,12,8,3),"probe1");
 $MyData->addPoints(array(3,12,15,8,5,-5),"probe2");
 $MyData->addPoints(array(2,7,5,18,19,22),"probe3");
 $MyData->addPoints(array(14,12,10,8,9,12),"probe4");
 $MyData->addPoints(array(3,4,5,7,6,4),"probe5");


 $MyData->setAxisName(0,"Temperatures");
 $MyData->addPoints(array("Jan","Feb","Mar","Apr","May","Jun"),"Labels");
 $MyData->setSerieDescription("Labels","Months");
 $MyData->setAbscissa("Labels");

 $MyData->setSerieOnAxis("probe4", 1);
 $MyData->setAxisPosition(1,AXIS_POSITION_RIGHT);

 $MyData->setSerieDrawable (array("probe4", "probe5"), FALSE);


 $myPicture = new pImage(700,400,$MyData);
 $myPicture->drawRectangle(0,0,699,399,array("R"=>0,"G"=>0,"B"=>0));


 $myPicture->setFontProperties(array("FontName"=>"../pchart/fonts/Forgotte.ttf","FontSize"=>11));
 $myPicture->drawText(250,55,"Average temperature",array("FontSize"=>20,"Align"=>TEXT_ALIGN_BOTTOMMIDDLE));

 $myPicture->setGraphArea(60,60,670,190);
 $myPicture->drawFilledRectangle(60,60,670,190,array("R"=>255,"G"=>255,"B"=>255,"Surrounding"=>-200,"Alpha"=>10));
 $myPicture->drawScale(array("DrawSubTicks"=>TRUE));
 $myPicture->drawLineChart(array("DisplayValues"=>TRUE,"DisplayColor"=>DISPLAY_AUTO));

 $MyData->setSerieDrawable (array("probe1", "probe2", "probe3"), FALSE);
 $MyData->setSerieDrawable (array("probe4", "probe5"), TRUE);


 $myPicture->setGraphArea(60,240,670,370);
 $myPicture->drawFilledRectangle(60,240,670,370,array("R"=>255,"G"=>255,"B"=>255,"Surrounding"=>-200,"Alpha"=>10));
 $myPicture->drawScale(array("DrawSubTicks"=>TRUE));
 $myPicture->drawLineChart(array("DisplayValues"=>TRUE,"DisplayColor"=>DISPLAY_AUTO));


 $myPicture->stroke();
?>
I'm struggling to generate two charts in same image. The problem that I have at this moment is that when I'm using my approach, i get some bad results. As you can see from the output picture, I get two vertical axes on the first chart. I need two vertical axes only on the second chart.
I assume that my code is bad, or my approach is bad. How do you generate two charts into the same image with pcharts. This problem arrives only when I need two vertical axes and multiple charts on same image.
and my code:
<?php
 include("../pchart/class/pData.class.php");
 include("../pchart/class/pDraw.class.php");
 include("../pchart/class/pImage.class.php");

 $MyData = new pData();
 $MyData->addPoints(array(-4,VOID,VOID,12,8,3),"probe1");
 $MyData->addPoints(array(3,12,15,8,5,-5),"probe2");
 $MyData->addPoints(array(2,7,5,18,19,22),"probe3");
 $MyData->addPoints(array(14,12,10,8,9,12),"probe4");
 $MyData->addPoints(array(3,4,5,7,6,4),"probe5");


 $MyData->setAxisName(0,"Temperatures");
 $MyData->addPoints(array("Jan","Feb","Mar","Apr","May","Jun"),"Labels");
 $MyData->setSerieDescription("Labels","Months");
 $MyData->setAbscissa("Labels");

 $MyData->setSerieOnAxis("probe4", 1);
 $MyData->setAxisPosition(1,AXIS_POSITION_RIGHT);

 $MyData->setSerieDrawable (array("probe4", "probe5"), FALSE);


 $myPicture = new pImage(700,400,$MyData);
 $myPicture->drawRectangle(0,0,699,399,array("R"=>0,"G"=>0,"B"=>0));


 $myPicture->setFontProperties(array("FontName"=>"../pchart/fonts/Forgotte.ttf","FontSize"=>11));
 $myPicture->drawText(250,55,"Average temperature",array("FontSize"=>20,"Align"=>TEXT_ALIGN_BOTTOMMIDDLE));

 $myPicture->setGraphArea(60,60,670,190);
 $myPicture->drawFilledRectangle(60,60,670,190,array("R"=>255,"G"=>255,"B"=>255,"Surrounding"=>-200,"Alpha"=>10));
 $myPicture->drawScale(array("DrawSubTicks"=>TRUE));
 $myPicture->drawLineChart(array("DisplayValues"=>TRUE,"DisplayColor"=>DISPLAY_AUTO));

 $MyData->setSerieDrawable (array("probe1", "probe2", "probe3"), FALSE);
 $MyData->setSerieDrawable (array("probe4", "probe5"), TRUE);


 $myPicture->setGraphArea(60,240,670,370);
 $myPicture->drawFilledRectangle(60,240,670,370,array("R"=>255,"G"=>255,"B"=>255,"Surrounding"=>-200,"Alpha"=>10));
 $myPicture->drawScale(array("DrawSubTicks"=>TRUE));
 $myPicture->drawLineChart(array("DisplayValues"=>TRUE,"DisplayColor"=>DISPLAY_AUTO));


 $myPicture->stroke();
?>
如果你对这篇内容有疑问,欢迎到本站社区发帖提问 参与讨论,获取更多帮助,或者扫码二维码加入 Web 技术交流群。

绑定邮箱获取回复消息
由于您还没有绑定你的真实邮箱,如果其他用户或者作者回复了您的评论,将不能在第一时间通知您!


发布评论
评论(1)
这可能是一个更好的方法,但我不知道如何在我的情况下使用它。我不需要饼图,并且 pImage 类仅支持尺寸作为第一个参数。
This might be a better approach, but I don't know how to use it in my case. I don't need pie charts, and pImage class supports only dimensions as the first params.