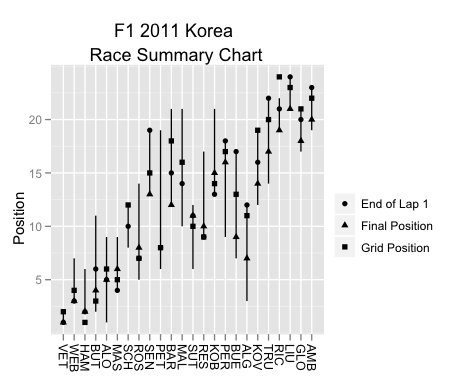
省略 ggplot2 中缺少的 x 轴值(将范围转换为分类变量)
我正在使用 ggplot 生成一个图表,总结由几圈组成的比赛。比赛共有24名参赛者,编号为1-12、14-25;我正在使用 ggplot 绘制每个参与者的汇总度量,但 ggplot 假设我想要数字范围 1-25,而不是类别 1-12、14-25。
有什么解决办法吗?这是我正在使用的代码(数据来自 Google 电子表格)。
sskey='0AmbQbL4Lrd61dHlibmxYa2JyT05Na2pGVUxLWVJYRWc'
library("ggplot2")
require(RCurl)

gsqAPI = function(key,query,gid){ return( read.csv( paste( sep="", 'http://spreadsheets.google.com/tq?', 'tqx=out:csv', '&tq=', curlEscape(query), '&key=', key, '&gid=', curlEscape(gid) ) ) ) }


sin2011racestatsX=gsqAPI(sskey,'select A,B,G',gid='13')
sin2011proximity=gsqAPI(sskey,'select A,B,C',gid='12')

h=sin2011proximity
k=sin2011racestatsX
l=subset(h,lap==1)

ggplot() +
geom_step(aes(x=h$car, y=h$pos, group=h$car)) +
scale_x_discrete(limits =c('VET','WEB','HAM','BUT','ALO','MAS','SCH','ROS','SEN','PET','BAR','MAL','','SUT','RES','KOB','PER','BUE','ALG','KOV','TRU','RIC','LIU','GLO','AMB'))+
xlab(NULL) + opts(title="F1 2011 Korea \nRace Summary Chart", axis.text.x=theme_text(angle=-90, hjust=0)) +
geom_point(aes(x=l$car, y=l$pos, pch=3, size=2)) +
geom_point(aes(x=k$driverNum, y=k$classification,size=2), label='Final') +
geom_point(aes(x=k$driverNum, y=k$grid, col='red')) +
ylab("Position")+
scale_y_discrete(breaks=1:24,limits=1:24)+ opts(legend.position = "none")
I am using ggplot to generate a chart that summarises a race made up from several laps. There are 24 participants in the race,numbered 1-12, 14-25; I am plotting out a summary measure for each participant using ggplot, but ggplot assumes I want the number range 1-25, rather than categories 1-12, 14-25.
What's the fix for this? Here's the code I am using (the data is sourced from a Google spreadsheet).
sskey='0AmbQbL4Lrd61dHlibmxYa2JyT05Na2pGVUxLWVJYRWc'
library("ggplot2")
require(RCurl)

gsqAPI = function(key,query,gid){ return( read.csv( paste( sep="", 'http://spreadsheets.google.com/tq?', 'tqx=out:csv', '&tq=', curlEscape(query), '&key=', key, '&gid=', curlEscape(gid) ) ) ) }


sin2011racestatsX=gsqAPI(sskey,'select A,B,G',gid='13')
sin2011proximity=gsqAPI(sskey,'select A,B,C',gid='12')

h=sin2011proximity
k=sin2011racestatsX
l=subset(h,lap==1)

ggplot() +
geom_step(aes(x=h$car, y=h$pos, group=h$car)) +
scale_x_discrete(limits =c('VET','WEB','HAM','BUT','ALO','MAS','SCH','ROS','SEN','PET','BAR','MAL','','SUT','RES','KOB','PER','BUE','ALG','KOV','TRU','RIC','LIU','GLO','AMB'))+
xlab(NULL) + opts(title="F1 2011 Korea \nRace Summary Chart", axis.text.x=theme_text(angle=-90, hjust=0)) +
geom_point(aes(x=l$car, y=l$pos, pch=3, size=2)) +
geom_point(aes(x=k$driverNum, y=k$classification,size=2), label='Final') +
geom_point(aes(x=k$driverNum, y=k$grid, col='red')) +
ylab("Position")+
scale_y_discrete(breaks=1:24,limits=1:24)+ opts(legend.position = "none")
如果你对这篇内容有疑问,欢迎到本站社区发帖提问 参与讨论,获取更多帮助,或者扫码二维码加入 Web 技术交流群。

绑定邮箱获取回复消息
由于您还没有绑定你的真实邮箱,如果其他用户或者作者回复了您的评论,将不能在第一时间通知您!

发布评论
评论(1)
扩展我的神秘评论,试试这个:
不再需要调用
scale_x_discrete。从风格上来说,我更喜欢将opts和xlab内容放在最后。编辑
一些注释以回应您的评论。通过更简化地使用 ggplot 可以缓解您的许多困难。您的数据格式很尴尬:
一些注释。您将美学设置为固定值(
size = 2),这应该在aes()外部完成。aes()用于将变量(即列)映射到美学(颜色、形状、大小等)。这使得 ggplot 能够智能地为您创建图例。合并后两个数据集,然后
melt将其创建一个分组变量,供ggplot在图例中使用。我使用了形状美学,因为一些值重叠;使用颜色可能会让人很难发现。一般来说,ggplot 会拒绝将美学混合到单个图例中。如果您想使用形状、颜色和大小,您将获得三个图例。我更喜欢使用

labs设置标签,因为您可以在一个地方完成所有这些操作。请注意,将美观标签设置为""会删除图例标题。Expanding on my cryptic comment, try this:
Calling
scale_x_discreteis no longer necessary. And stylistically, I prefer puttingoptsandxlabstuff at the end.Edit
A few notes in response to your comment. Many of your difficulties can be eased by a more streamlined use of
ggplot. Your data is in an awkward format:A few notes. You were setting aesthetics to fixed values (
size = 2) which should be done outside ofaes().aes()is for mapping variables (i.e. columns) to aesthetics (color, shape, size, etc.). This allows ggplot to intelligently create the legend for you.Merging the second two data sets and then
melting it creates a grouping variable forggplotto use in the legend. I used the shape aesthetic since a few values overlap; using color may make that hard to spot. In general, ggplot will resist mixing aesthetics into a single legend. If you want to use shape, color and size you'll get three legends.I prefer setting labels using

labs, since you can do them all in one spot. Note that setting the aesthetic label to""removes the legend title.