测试噪声生物数据的周期性:周期图显着性?
我正在尝试分析 R 中的一些噪声时间序列数据。这些数据基于动物的二氧化碳排放量,它们显示出一种我想描述的循环周期性。我想测试以下假设:
H0:没有循环二氧化碳排放(即不超过随机排放)。
H1:存在循环或脉冲形式的 CO2 排放模式。
为此,我将数据导入 R,将其转换为时间序列类,并绘制其周期图。
t25a <- read.table("data.txt", header=TRUE, sep="\t")
t1 <- ts(t25a$Co2)
plot(t1)
spec.pgram(t1, spans=4, log="no")
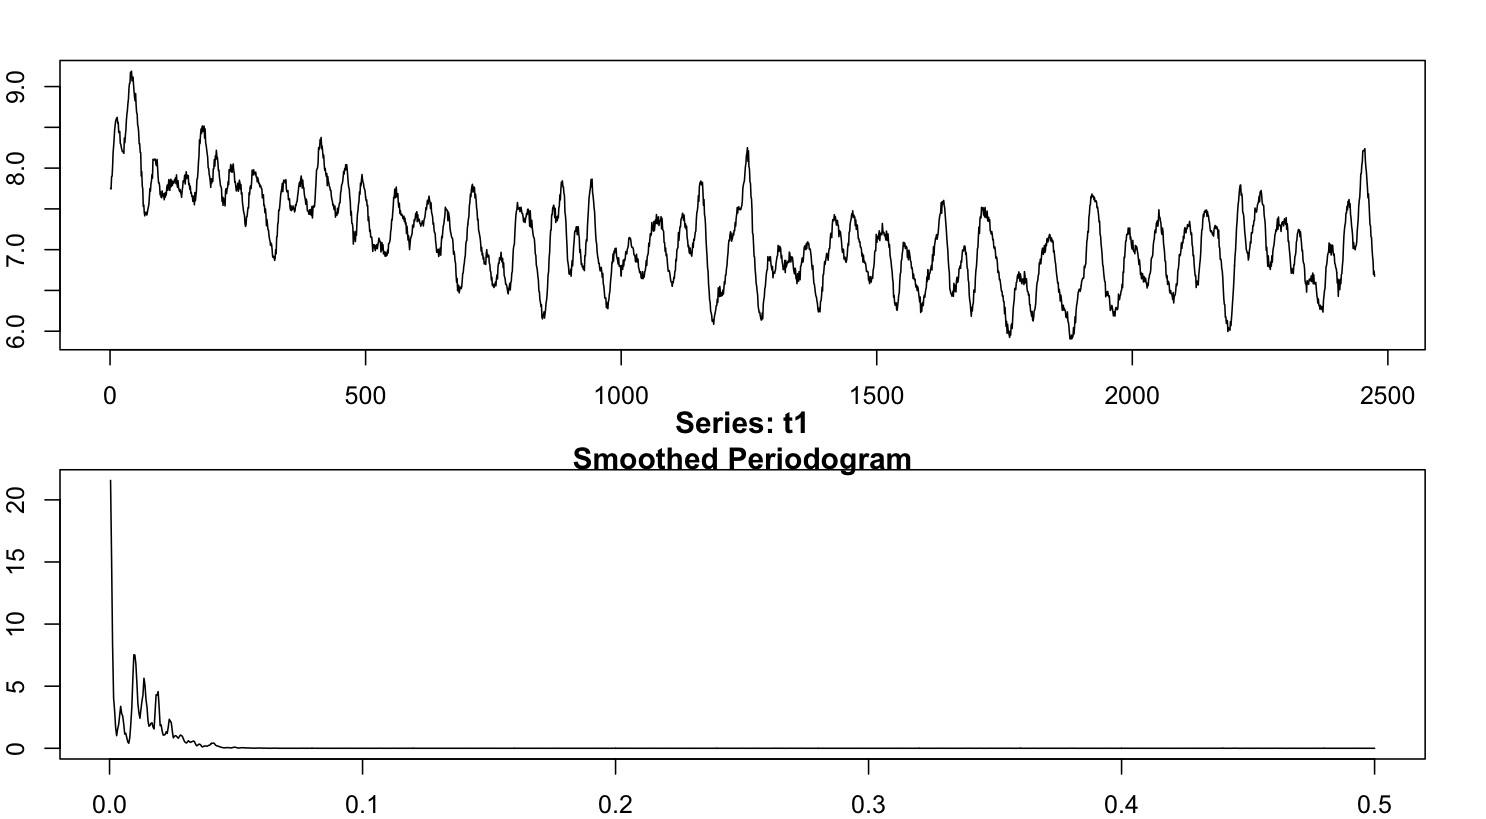
其外观如下,原始数据绘制在顶部,周期图绘制在下面:
img src="https://i.sstatic.net/tc47F.jpg" alt="R periodogram of time series CO2 data">
< 在底部的图中,我可以看到四个或五个有些不同的峰值,表明数据中的频率分量。我的问题是——它们都同样“重要”吗?有什么方法可以测试观察到的峰值是否彼此显着不同或与原假设的预测显着不同?我所知道的就是找到与这些峰值相关的频率,但我想要一种更客观的方法来确定数据中确实有多少个“重要”峰值。
I'm trying to analyze some noisy time-series data in R. The data are based on the CO2 emission of animals and they show a sort of cyclic periodicity that I'd like to characterize. I'd like to test the hypotheses:
H0: There is no cyclic CO2 emission (i.e. no more than random).
H1: There is a pattern of CO2 emission in cycles or pulses.
So to do this I've imported the data into R, converted it to a time series class, and plotted its periodogram.
t25a <- read.table("data.txt", header=TRUE, sep="\t")
t1 <- ts(t25a$Co2)
plot(t1)
spec.pgram(t1, spans=4, log="no")
Here's what that looks like, with the raw data plotted on top and the periodogram beneath:

In the bottom figure, I can see four or five somewhat-distinct peaks indicating a frequency component in the data. My question is -- are they all equally "important"? Is there any way to test whether the observed peaks are significantly different from each other or from the predictions of the null hypothesis? All I know how to do is find the frequency associated with those peaks, but I'd like a more objective method for determining how many "significant" peaks there really are in the data.
如果你对这篇内容有疑问,欢迎到本站社区发帖提问 参与讨论,获取更多帮助,或者扫码二维码加入 Web 技术交流群。

绑定邮箱获取回复消息
由于您还没有绑定你的真实邮箱,如果其他用户或者作者回复了您的评论,将不能在第一时间通知您!

发布评论
评论(1)
一种选择是在零假设下模拟数据集(不具有您正在寻找的周期性,但仍然具有其他时间序列特征)。如果您有数值检验统计量(峰值数或其他测量值),那么您可以为许多模拟数据集中的每一个计算该统计量,这将为您提供抽样分布,只需将实际数据的检验统计量与抽样进行比较分配。如果您没有直接的数字测试统计数据,那么您可以考虑进行视觉测试,请参阅:
R 的
TeachingDemos包中的vis.test函数有助于实现此测试(但也有其他方法)。One option would be to simulate data sets under your null hypothesis (don't have the periodicity that you are looking for, but still have the other time series characteristics). If you have a numerical test statistic (number of peaks, or some other measure) then you can compute this for each of many simulated data sets and this will give you the sampling distribution, just compare the test statistic for your actual data to the sampling distribution. If you don't have a straight forward numeric test statistic then you might consider doing a visual test, see:
The
vis.testfunction in theTeachingDemospackage for R helps with implementing this test (but there are other ways as well).