iPhone Core-plot:图表放大缩小,Y轴变大,Y轴变小
我现在使用 Core-plot 进行 iPhone 图表开发。 但它有一些我无法达到的要求。
我现在使用CorePlot 0.4,示例代码AAPLot来开发
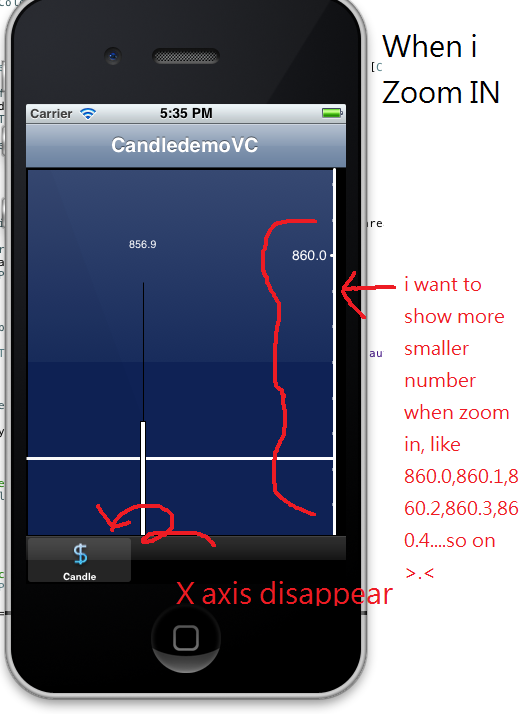
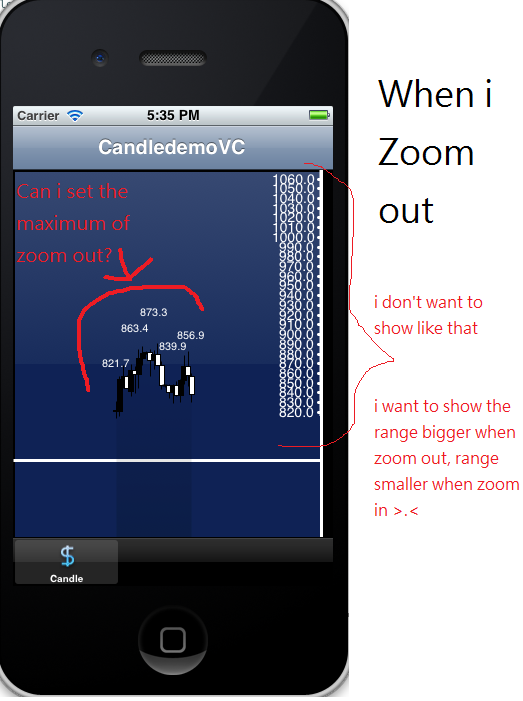
请看下面的图片,然后你就会知道我的问题是什么 非常感谢...
我真的需要帮助解决这个问题, 谢谢


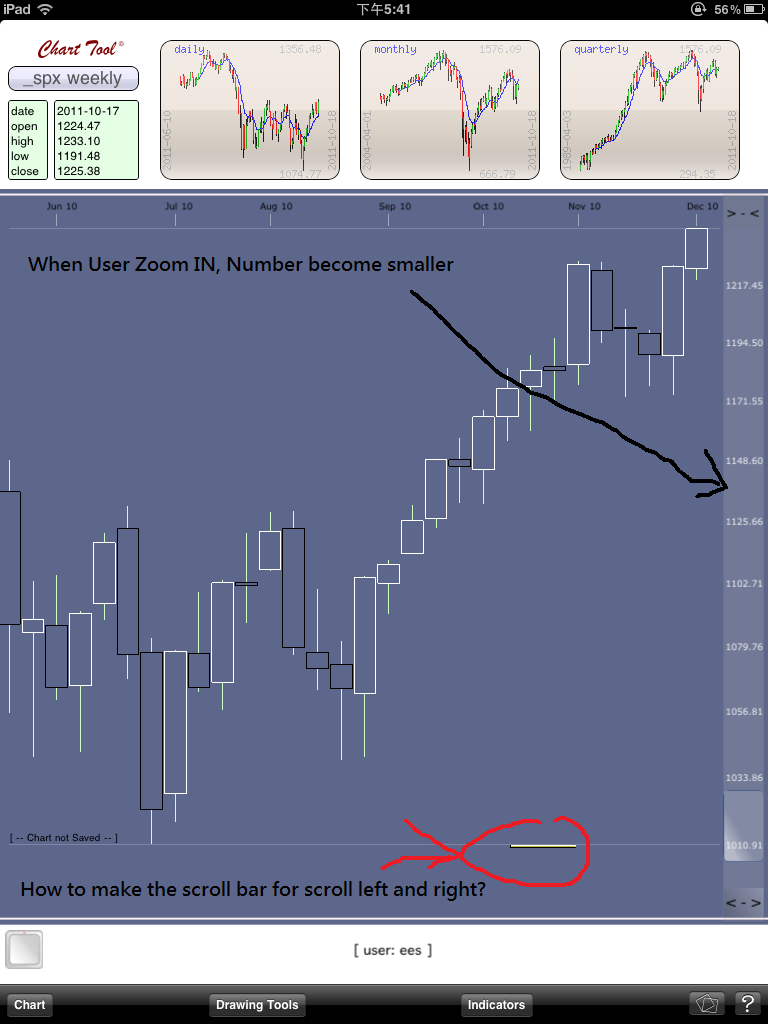
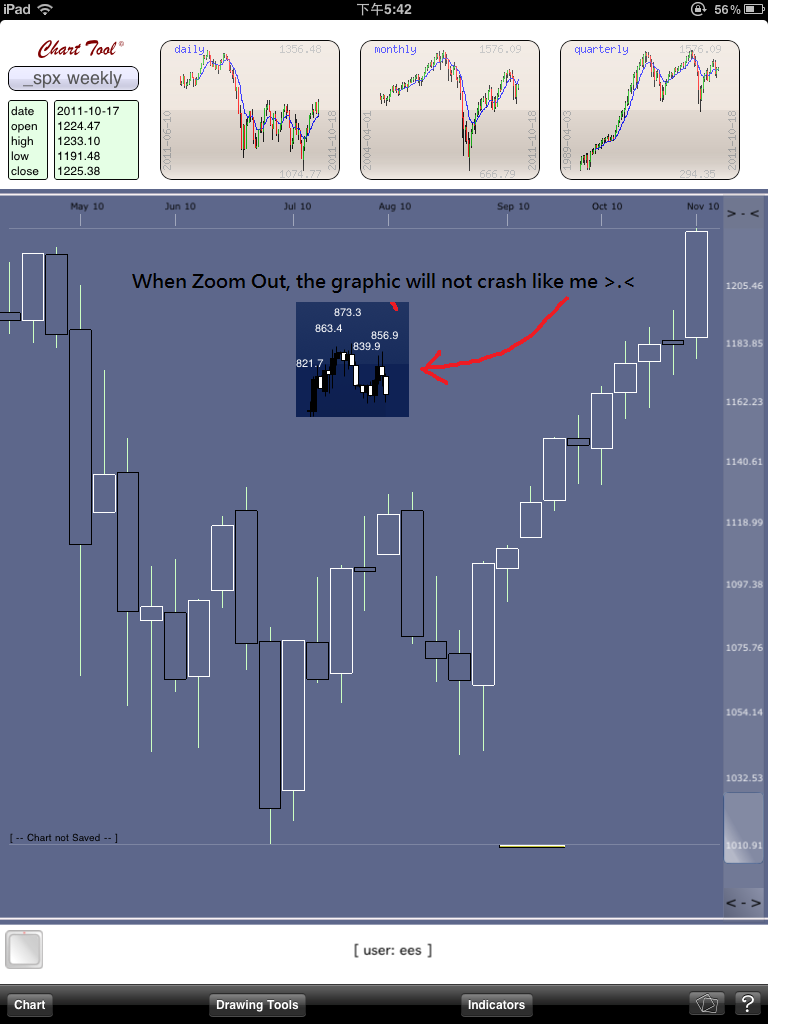
我想要像此应用程序一样的结果


I am now using Core-plot for iPhone chart Development.
But it has some requirement i can not reach.
I am now using CorePlot 0.4, example code AAPLot to develop
Please have a look the following image, then you will know what is my problem
Thank you very much...
I really need help for this problem,
thank you


i want my result like this application


如果你对这篇内容有疑问,欢迎到本站社区发帖提问 参与讨论,获取更多帮助,或者扫码二维码加入 Web 技术交流群。

绑定邮箱获取回复消息
由于您还没有绑定你的真实邮箱,如果其他用户或者作者回复了您的评论,将不能在第一时间通知您!

发布评论
评论(1)
我在这里看到几个问题:
Y 轴刻度:在 y 轴上尝试使用
CPTAxisLabelingPolicyAutomatic标签策略。如果这不能为您提供足够的控制,请使用不同的标签策略并使用绘图空间委托在用户放大和缩小时调整标签参数。消失的x轴:使其成为“浮动”轴。例如,
最大缩放级别:使用
globalXRange和globalYRange绘图空间属性。如果需要更多控制,可以使用绘图空间委托。滚动条:不直接支持。您可以使用绘图空间委托来更新滚动条位置。
I see several questions here:
Y-axis scale: Try the
CPTAxisLabelingPolicyAutomaticlabeling policy on your y-axis. If that doesn't give you enough control, use a different labeling policy and use a plot space delegate to adjust the labeling parameters as the user zooms in and out.Disappearing x-axis: Make it a "floating" axis. For example,
Maximum zoom level: Use the
globalXRangeandglobalYRangeplot space properties. If you need more control, you can use a plot space delegate.Scroll bars: This isn't directly supported. You could use a plot space delegate to update the scroll bar position.