在绘图中嵌入微型绘图
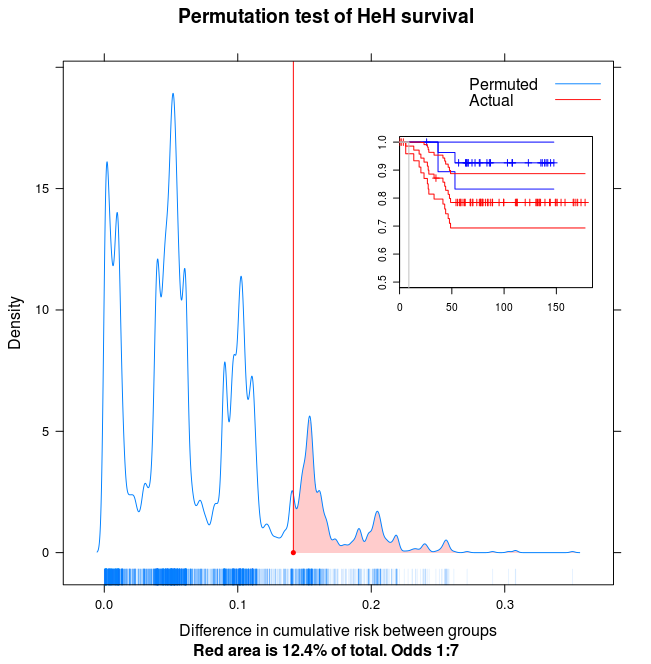
有谁知道将绘图嵌入到其他绘图中以生成类似下面的模型的通用方法?
我知道在点阵中你可以用 print(..., more=TRUE, Positions=...) 来完成,如 这个问题,我想 ggplot 也有一个解决方案(但我不太擅长 ggplot)。问题是我想将使用标准图形包的生存包中的常规图嵌入到格子图中。

提前致谢!
Does anybody know of a general way to embed plots into other plots to produce something like the mockup below?
I know that in lattice you can do it with print(..., more=TRUE, positions=...) as explained in this question, and I guess ggplot has a solution to it aswell (but I'm not very good with ggplot). The problem is that I want to embed a regular plot from the survival package that use the standard graphics package into a lattice plot.

Thanks in advance!
如果你对这篇内容有疑问,欢迎到本站社区发帖提问 参与讨论,获取更多帮助,或者扫码二维码加入 Web 技术交流群。

绑定邮箱获取回复消息
由于您还没有绑定你的真实邮箱,如果其他用户或者作者回复了您的评论,将不能在第一时间通知您!

发布评论
评论(3)
您可以尝试 gridBase 包,它提供了一些集成基础图形和基于网格的图形(包括lattice和ggplot2)的功能。下面的示例将基本图形图嵌入到点阵图中。
更多详细信息请参见:http://casoilresource.lawr.ucdavis.edu/drupal/node/1007
在这里: http://cran.r-project.org/ web/packages/gridBase/vignettes/gridBase.pdf
You could try the gridBase package which provides some functionality for integrating base and grid-based graphics (including lattice and ggplot2). The example below embeds a base graphics plot inside of a lattice plot.
More detail here: http://casoilresource.lawr.ucdavis.edu/drupal/node/1007
And here: http://cran.r-project.org/web/packages/gridBase/vignettes/gridBase.pdf
查看教学演示包 TeachingDemos 包 - 和 < code>subplot() 函数 它也可能在格子上工作 - 但还没有尝试过。
Check out the Teaching Demos package package TeachingDemos package - and the
subplot()function It might work on the lattice as well - haven't tried it though.这是一种相反的方法,在基本图形中使用 ggplot2 图形:
And here is a way to do it the other way around, ggplot2 graphic in a base graphic: