如何摆脱 Circos 中的直方图网格
我正在使用 Circos 绘制一些直方图。如何摆脱下面示例中的垂直网格?
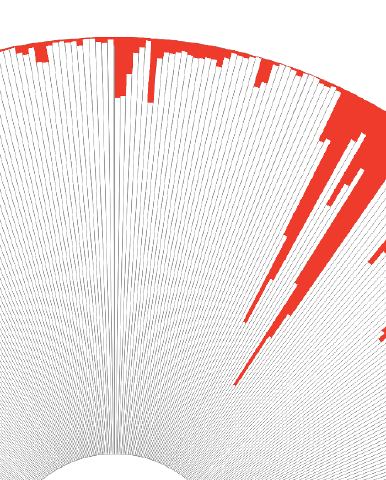
I am using Circos to plot some histograms. How can I get rid of the vertical grids in the example below?
如果你对这篇内容有疑问,欢迎到本站社区发帖提问 参与讨论,获取更多帮助,或者扫码二维码加入 Web 技术交流群。

绑定邮箱获取回复消息
由于您还没有绑定你的真实邮箱,如果其他用户或者作者回复了您的评论,将不能在第一时间通知您!


发布评论
评论(1)
这是 circos 网格课程。
希望它有用,这里还有示例 circos 输出图片: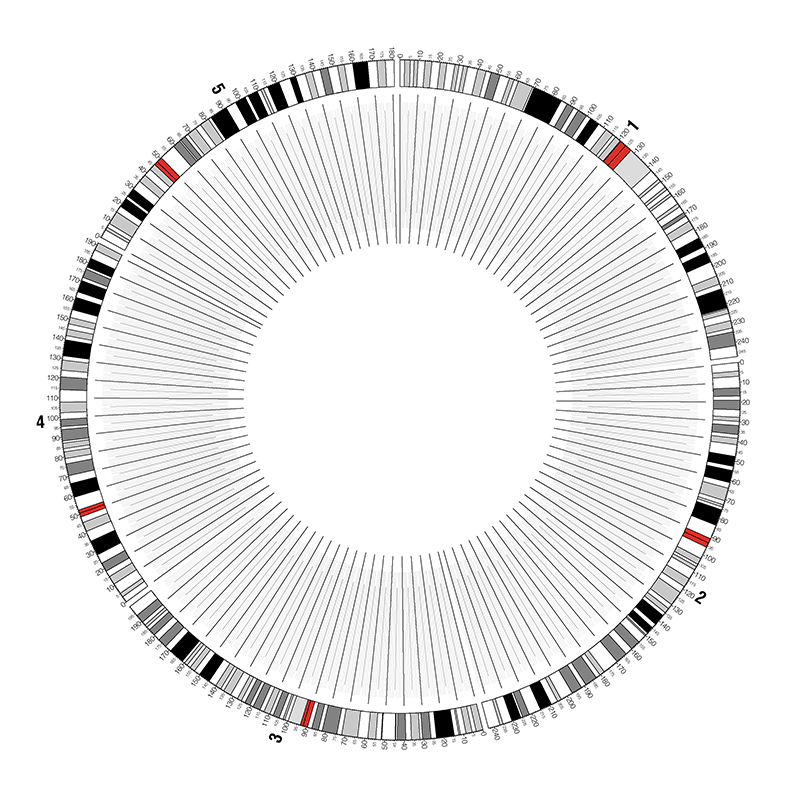
Here is the circos grids lesson.
Hope it useful and also here is the example circos out picture: