如何在Android中使用canvas设计图表?
我想使用画布或其他方法在android中设计以下图表,请帮助我...
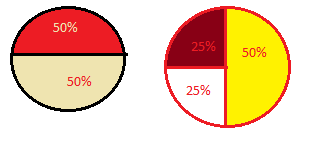
如图所示,我想根据百分比输入绘制圆的部分,例如。圆圈的 50% 部分为红色,50% 部分为奶油色,并带有一些文字,如图所示。
i want to design following charts in android using canvas or other methods please help me...
As Show in image i want to draw sections of circle as per input in percentage Ex. 50% part of circle is red color and 50% part in cream color with some text as show in image.

如果你对这篇内容有疑问,欢迎到本站社区发帖提问 参与讨论,获取更多帮助,或者扫码二维码加入 Web 技术交流群。

绑定邮箱获取回复消息
由于您还没有绑定你的真实邮箱,如果其他用户或者作者回复了您的评论,将不能在第一时间通知您!

发布评论
评论(2)
可能会有帮助,
could be helpful,
您可以使用此类图表的图表引擎。
检查这个网址:
http://www.artfulbits.com/articles/samples /aicharts/sample-viewer.aspx?sample=piesample
问候,
吉里什
you can you chart engine for this type of chart.
check this url:
http://www.artfulbits.com/articles/samples/aicharts/sample-viewer.aspx?sample=piesample
Regards,
Girish