如何在matlab中提取感兴趣区域内的对象
我有兴趣提取该区域内的对象。
例如,
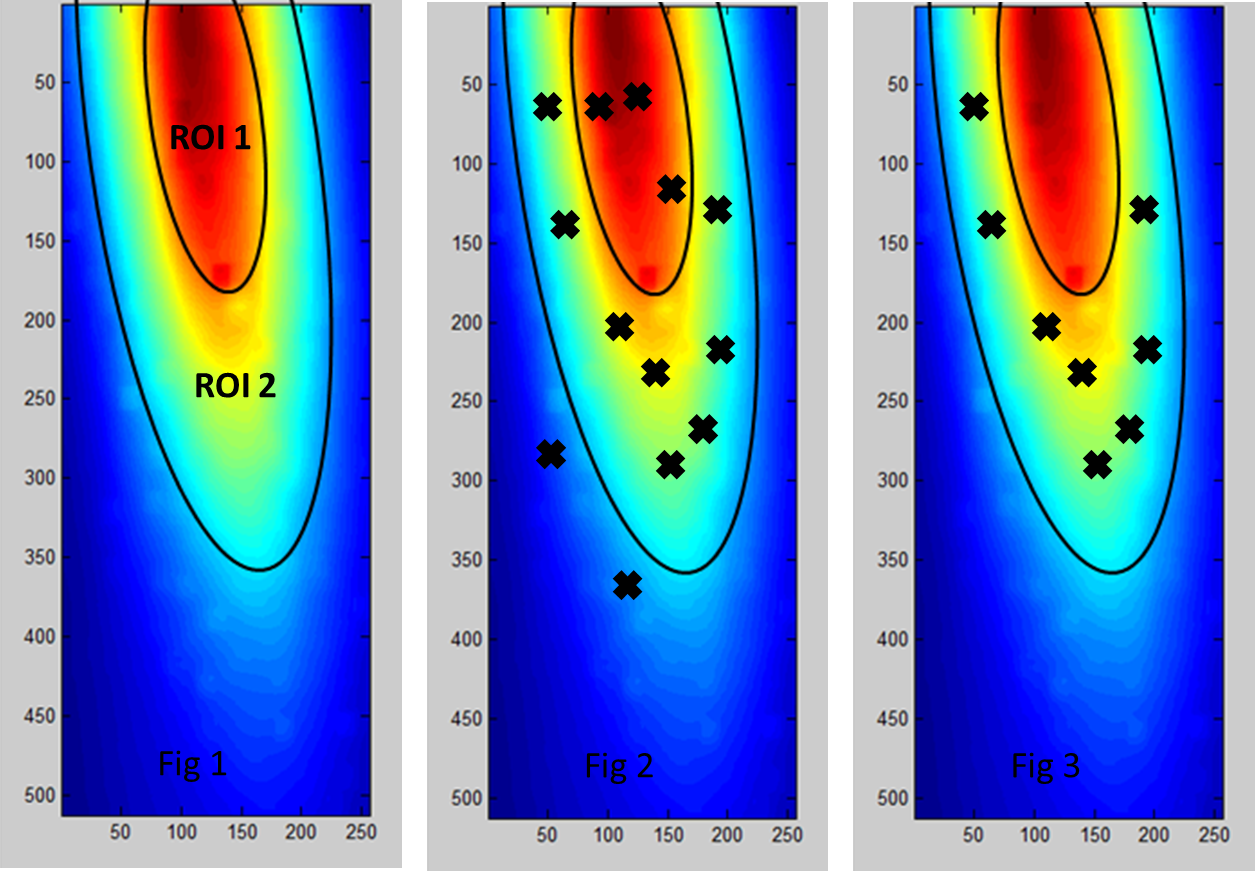
图 1 显示了我的激光轮廓的强度轮廓。根据激光强度,我将轮廓分为 2 个感兴趣区域(ROI1 和 ROI2)。
图 2 显示了我的阳性反应实验结果与激光强度分布的重叠。阳性响应数据文件由 x 和 y 坐标组成。正如您所看到的,结果分散在激光轮廓图像上。
这就是我想要做的,我想提取 ROI2 内的点并丢弃所有其余的,如图 3 所示。我该怎么做呢?具体来说,如何在matlab中定义不规则形状的ROI2并提取阳性反应数据的坐标。 感谢您的帮助。

I am interested in extracting the objects inside the region.
For example,
Fig1 showed the intensity profile of my laser profile. According to the laser intensity, I divide the profile into 2 region of interest (ROI1 and ROI2).
Fig2 showed the overlap of my exp result of positive responses and the laser intensity profile. The positive response data file is composed of x and y coordinates. As you can see the results are scattered over the laser profile image.
Here is what I want to do, I want to extract the spots within the ROI2 and discard all the rest as shown in Fig3. How can I do it? Specifically, how can I define a irregular shape ROI2 in matlab and extract the coordinates of positive response data.
Thanks for the help.

如果你对这篇内容有疑问,欢迎到本站社区发帖提问 参与讨论,获取更多帮助,或者扫码二维码加入 Web 技术交流群。

绑定邮箱获取回复消息
由于您还没有绑定你的真实邮箱,如果其他用户或者作者回复了您的评论,将不能在第一时间通知您!

发布评论
评论(3)
正如 eykanal 所说,您可以使用 impoly 函数来创建任何您想要的图像投资回报率。提取坐标的通用解决方案是创建所需的 ROI,并使用 find< /a> 提取坐标并进行一些设置操作以删除不需要的点。像这样:
As eykanal says, you can use the impoly function to create any sort of ROI you want in your image. A general solution for extracting coordiantes is to create the ROI you want, and the use find to extract the coordinates and some set operation to remove unwanted points. Like this:
我认为这个问题比你想象的更容易,只要你总是沿着(看起来的)轮廓线分割图像。您想要选择值大于等高线 1 且小于等高线 2 的所有点。我不确定您如何指定等高线,但选择命令应该简单为:
如果,如图所示,您简单地根据值设置轮廓,然后可以将
mean(contour1points)替换为用户定义的值,使用该函数获取光标下像素的值,这是我不可能发生的现在回想起来。如果要定义多边形,请查看impoly函数。I think this problem is easier than you think, provided you always segment the image along (what appear to be) contour lines. You want to select all points which have a value greater than contour line 1 and less than contour line 2. I'm not sure how you specified the contour lines, but the selection command should simply be:
If, as it appears, you're simply setting contours based on value, then the
mean(contour1points)could be replaced by a user-defined value, using the function to get the value of the pixel under the cursor which I can't happen to recall right now. If you want to define a polygon, check out theimpolyfunction.我不知道您对 ROI 使用什么表示形式,但我建议一些方法:
如果您的 ROI 是椭圆形并且您知道它的方程,只需将其应用于结果坐标即可。使用符号来确定它是否在内部
如果您的 ROI 是某种多边形,您可以使用函数inpolygon
您可以将 ROI 渲染为黑白图像并轻松测试命中/未命中。
请提供有关 ROI 表示的更多详细信息。
I don't know what representation you use for your ROIs, but I would suggest some methods:
If your ROI is an ellipse and you know its equation just apply it to the results coordinates. Use the sign to decide if whether it is inside or not
If your ROI is a polygon of some kind you can use the function inpolygon
You could render the ROIs to black and white images and easily test hit/miss.
Please provide more details regarding the ROI representation.