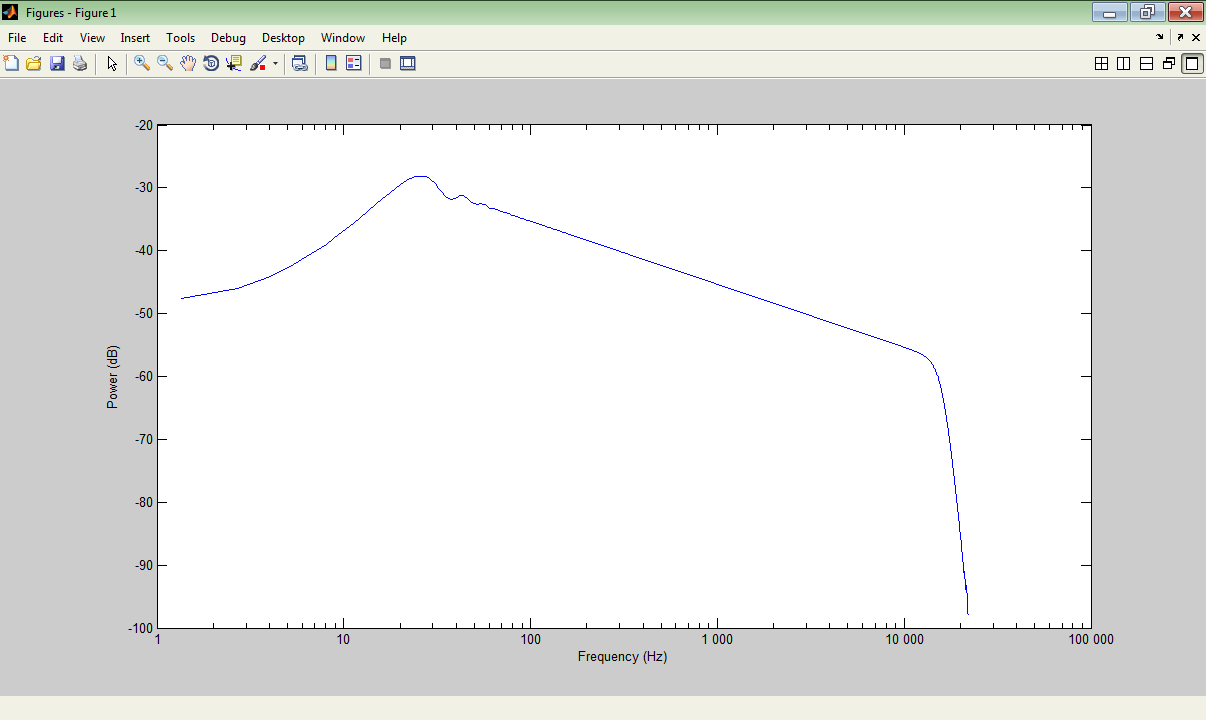
FFT后校直幅频响应图
我已将一个对数扫频正弦(带有一些短的淡入/淡出)加载到 Matlab 中,并通过 fft 函数运行它,并使用半对数绘制它。
输入信号幅度在 10 ... 20000 Hz 范围内几乎恒定。因此,为了更准确地表示正在发生的情况,我希望将图表视为几乎水平的线。
我应该应用什么公式来使 AFR 图形水平?
我用来绘制图形的 Matlab 脚本:
fid = fopen('sweepfaded.raw','rb');   %open file
data = fread(fid, inf, 'float32');  %read in the data
fclose(fid);   %close file

n = size(data,1);

n = 2^nextpow2(n); % Next power of 2 from length of audio - 2-powers are faster to calculate

p = fft(data, n); % take the fourier transform

nUniquePts = ceil((n+1)/2);
p = p(1:nUniquePts); % select just the first half since the second half
                       % is a mirror image of the first
p = abs(p); % take the absolute value, or the magnitude
p = p/n; % scale by the number of points so that
           % the magnitude does not depend on the length
           % of the signal or on its sampling frequency
p = p.^2;  % square it to get the power

sampFreq = 44100;
freqArray = (0:nUniquePts-1) * (sampFreq / n); % create the frequency array
semilogx(freqArray, 10*log10(p))

xlabel('Frequency (Hz)')
ylabel('Power (dB)')
我希望得到的图形是水平的(就像对其应用一些旋转,因此范围为 100) ...10000 Hz 成为水平线):

PS 我不擅长音频信号处理,我是只是一个通用程序员,所以不要浪费时间试图解释正在发生的事情(尽管我猜,有一天我无论如何都必须阅读一本好的 DSP 书籍)。只需将正确的公式插入到我的 Matlab 脚本中就足够了。
I have loaded a logarithmic swept sine (with some short fade in/fade out) into Matlab and run it through the fft function and plot it using semilog.
The input signal amplitude is almost constant in 10 ... 20000 Hz range. So to represent more accurately what is going on, I would like to see the graph as almost horizontal line.
What formula should I apply to make the AFR graph horizontal?
The Matlab script I used to plot the graph:
fid = fopen('sweepfaded.raw','rb');   %open file
data = fread(fid, inf, 'float32');  %read in the data
fclose(fid);   %close file

n = size(data,1);

n = 2^nextpow2(n); % Next power of 2 from length of audio - 2-powers are faster to calculate

p = fft(data, n); % take the fourier transform

nUniquePts = ceil((n+1)/2);
p = p(1:nUniquePts); % select just the first half since the second half
                       % is a mirror image of the first
p = abs(p); % take the absolute value, or the magnitude
p = p/n; % scale by the number of points so that
           % the magnitude does not depend on the length
           % of the signal or on its sampling frequency
p = p.^2;  % square it to get the power

sampFreq = 44100;
freqArray = (0:nUniquePts-1) * (sampFreq / n); % create the frequency array
semilogx(freqArray, 10*log10(p))

xlabel('Frequency (Hz)')
ylabel('Power (dB)')
The resulting plot which I would like to be horizontal (like applying some rotation to it so the range 100...10000 Hz becomes a horizontal line):

P.S. I am not good at audio signal processing, I am just a generic programmer, so do not waste your time trying to explain what is going on (although I guess, someday I'll have to read a good DSP book anyway). Just a correct formula to insert into my Matlab script will be good enough.
如果你对这篇内容有疑问,欢迎到本站社区发帖提问 参与讨论,获取更多帮助,或者扫码二维码加入 Web 技术交流群。

绑定邮箱获取回复消息
由于您还没有绑定你的真实邮箱,如果其他用户或者作者回复了您的评论,将不能在第一时间通知您!


发布评论
评论(2)
仅当每个频率仓中的能量相同时,您的频谱才会平坦 - 这意味着您的正弦波必须在 FFT 采样窗口的持续时间内以恒定(线性)速率进行扫描。
理想情况下,您还应该在 FFT 之前应用窗口函数,以减少窗口函数的影响="http://en.wikipedia.org/wiki/Spectral_leakage" rel="nofollow">频谱泄漏,但这会影响扫频正弦的最终幅度,您需要对此进行补偿。
Your spectrum will only be flat if you have the same amount of energy in each frequency bin - this means that your sine wave must be swept at a constant (linear) rate for the duration of the FFT sampling window.
Ideally you should also be applying a window function prior to the FFT to reduce the effect of spectral leakage, however this will affect the resulting magnitudes of the swept sine and you would need to compensate for this.
响应校正因子将取决于对数扫描的精确速率。在 FFT 之前使用合适的窗函数可以减少低频角的一些扇贝。
The response correction factor will depend on the exact rate of the logarithmic sweep. Some of the scalloping at the low frequency corner can be reduced by the use of a suitable window function before the FFT.