MATLAB:颜色显示不正确?
我注意到 MATLAB 有时会错误地显示我的颜色。我不确定这是我这边的编程错误,还是 MATLAB 中的实际错误。在过去一年左右的时间里,我注意到这种行为有一定的规律性。
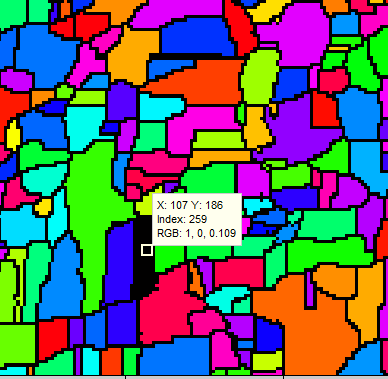
这次,我决定拍摄出现问题的图形的快照(在 Windows 7 64 位上的 MATLAB 2011b 上拍摄):
; 
显示相关图像的代码如下:
figure;
clf;
cla;
imshow(matrix, []);
colormap(cmap);
set(gca, 'Clim', [0 highest_index]);
其中:
matrix为输入uint32(尽管我也尝试在调用imshow之前将matrix显式转换为double- )代码>矩阵之间的范围
0和900 cmap有901条目highest_index为900code>
在上图中和颜色图数组中,matrix 中值 259 的 RGB 条目都是 [1, 0, 0.1] cmap,即 cmap(300, :) = [1, 0, 0.1] (请注意,矩阵值 259 获取颜色图中的索引 300 ,因为颜色图的第一个条目是矩阵值 0)。
问题:
为什么会发生这种情况?这是一个错误吗?我做错了什么吗?
更新 1:
- 我尝试将
CDataMapping切换为direct或scaled,但没有什么区别。 - 我还尝试使用
imagesc而不是imshow,但没有什么区别。 如果我首先将图像转换为 RGB(即将
索引图像转换为真彩色图像;请参阅此处了解更多信息),即使用i_rgb = ind2rgb(i_indexed, cmap),错误消失并且图像正确显示。不幸的是,如果我显示
真彩色图像,数据提示不再显示原始矩阵中每种颜色的索引,而是仅显示 RGB 向量(即这是合乎逻辑的,因为MATLAB 不再知道原始索引)。
更新 2:
这是一些示例代码:
h_f = figure(1);
clf;
i_spiral = spiral(40);
h_i = image(i_spiral);

% Synthesize a colormap first in HSV and then transform it to RGB:
max_i_spiral = max(i_spiral(:));
m           = max_i_spiral;
h           = (0:m-1)'/max(m,1);
cmap_spiral = hsv2rgb([h ones(m,2)]);
colormap(cmap_spiral);

% If I comment out the following two lines or use imshow instead of image,
% it makes no difference (I still get the same error):
set(gca, 'Clim', [1 max_i_spiral]);
set(h_i, 'CDataMapping', 'direct');
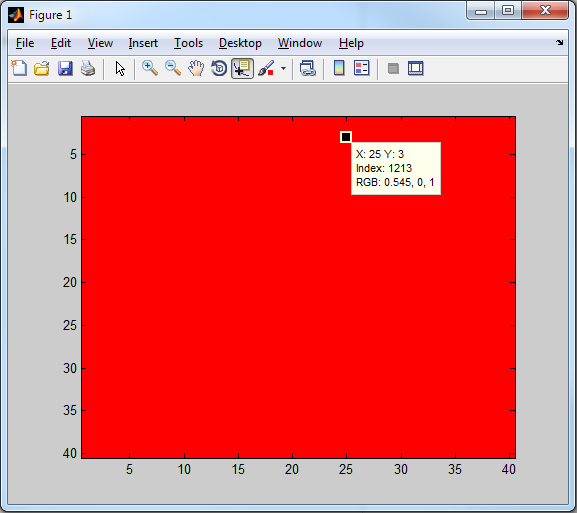
上面的代码结果为:

I have noticed that MATLAB sometimes displays my colors incorrectly. I'm not sure if this is a programming error on my side, or if it is an actual bug in MATLAB. I noticed this behavior with some regularity over the last year or so.
This time, I decided to take a snapshot of a figure with the error in question (taken on MATLAB 2011b on Windows 7, 64 bit):
The code that displays the image in question is the following:
figure;
clf;
cla;
imshow(matrix, []);
colormap(cmap);
set(gca, 'Clim', [0 highest_index]);
where:
matrixis of typeuint32(although I have also tried explitly castingmatrixasdoubleprior to callingimshow)- The values in
matrixrange between0and900 cmaphas901entrieshighest_indexis900
The RGB entry for the value 259 in matrix is [1, 0, 0.1] both in the image above and in the colormap array cmap, i.e. cmap(300, :) = [1, 0, 0.1] (notice that the matrix value 259 gets the index 300 in the colormap, since the first entry of the colormap is for the matrix value 0).
Questions:
Why does this happen? Is it an error? Is there anything I am doing wrong?
Update 1:
- I tried switching
CDataMappingtodirectorscaled, but it didn't make a difference. - I also tried using
imagescinstead ofimshow, but it didn't make a difference. If I convert the image to RGB first (i.e. transform the
indexed imageto atrue colorimage; see here for more info on this), i.e. withi_rgb = ind2rgb(i_indexed, cmap), the error goes away and the image is displayed correctly.Unfortunately, if I display a
true colorimage the data tip does not reveal the index in the original matrix for each color anymore and instead it just displays the RGB vector (i.e. this is logical, since MATLAB is not aware of the original index anymore).
Update 2:
Here's some sample code:
h_f = figure(1);
clf;
i_spiral = spiral(40);
h_i = image(i_spiral);

% Synthesize a colormap first in HSV and then transform it to RGB:
max_i_spiral = max(i_spiral(:));
m           = max_i_spiral;
h           = (0:m-1)'/max(m,1);
cmap_spiral = hsv2rgb([h ones(m,2)]);
colormap(cmap_spiral);

% If I comment out the following two lines or use imshow instead of image,
% it makes no difference (I still get the same error):
set(gca, 'Clim', [1 max_i_spiral]);
set(h_i, 'CDataMapping', 'direct');
The code above results in:
如果你对这篇内容有疑问,欢迎到本站社区发帖提问 参与讨论,获取更多帮助,或者扫码二维码加入 Web 技术交流群。

绑定邮箱获取回复消息
由于您还没有绑定你的真实邮箱,如果其他用户或者作者回复了您的评论,将不能在第一时间通知您!


发布评论
评论(3)
[由于这个答案与我之前的答案完全无关,所以我不会编辑第一个]
您提到的链接(http://www.mathworks.com/help/matlab/creating_plots/image-types.html)
说:
所以看来问题是你的颜色图有超过 256 个值。它还解释了为什么如果不使用索引图像问题就会消失。尝试使用不同的渲染器,如注释中技术支持链接中的建议:
或
[Since this answer is totally unrelated to my former answer, I'm not editing the first]
The link you mention (http://www.mathworks.com/help/matlab/creating_plots/image-types.html)
says:
So it seems the problem is that your colormap has more then 256 values. It also explains why the problem goes away if you don't use an indexed image. Try using a different renderer, as suggested in the technical support link from the note:
or
使用 IMSHOW 的更好方法是:
这是您的示例稍微重写:
编辑:
感谢 @ItamarKatz,我们现在知道,在 Windows 上,如果您使用以下命令显示索引图像超过 256 种颜色,不得使用“画家”算法作为渲染器。
IMSHOW(它在下面调用较低级别的 IMAGE 函数)检测这种情况并正确处理它。
如果您仍想使用 IMAGE/IMAGEESC,则必须了解索引图像数据类型:
图像包含
[1 length(cmap)]范围内的整数作为当前颜色映射中的索引图像包含
[0 255](对于uint8)或[0 65535](对于uint16)范围内的整数,解释为当前颜色图中的索引。因此,存在一个偏移量(范围从
0或1开始),您应该小心。这是与上面直接使用 IMAGE 函数相同的示例(一次使用 double 数据类型,另一个使用 uint16):
A better way to use IMSHOW is:
Here is your example slightly rewritten:
EDIT:
Thanks to @ItamarKatz, we now know that on Windows, if you are displaying an indexed image with more than 256 colors, one must not use the 'painters' algorithm as renderer.
IMSHOW (which underneath calls the lower level IMAGE function), detects such a case and correctly handles it.
If you still want to use IMAGE/IMAGESC, you must be aware of the indexed image data type:
Image contains integers in the range
[1 length(cmap)]as indices in the current colormapImage contains integers in the range
[0 255]foruint8or[0 65535]foruint16, interpreted as indices in the current colormap.thus there is an offset (range starts at
0or1) which you should be careful about.Here is the same example as above using IMAGE function directly (once with double data type, the other with uint16):
我不是 100% 确定(没有您的数据无法验证),但我认为原因是数据提示显示函数回调完成的错误映射/舍入。您可以创建自己的回调,方法是右键单击数据提示,选择
编辑文本更新函数...,然后输入类似内容:请注意,上面的代码假定颜色图长度和数据范围绘制的矩阵是相同的 - 就像你的例子一样。
要保存回调,请单击
保存并关闭,下次您可以通过右键单击数据提示并选择选择文本更新函数...来重新选择它I am not 100% sure (couldn't verify without your data), but I think the reason is wrong mapping/rounding done by the data-tip display function callback. You can create your own callback, by right-clicking the data tip, selecting
Edit Text Update Function..., and entering something like that:Note that the above code assumes the colormap length and and data range of the matrix plotted are the same - like in your example.
To save the callback, click
save and close, and you can re-select it on next occasions by right-clicking the data tip and selectingSelect Text Update Function...