如何使用 Raphael 在对象的内边缘创建渐变填充?
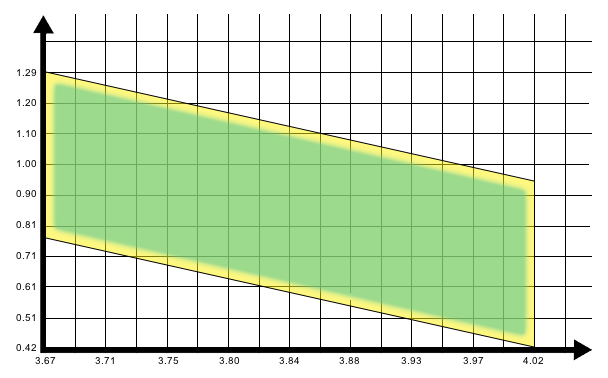
我有一个动态生成的图表,它说明了适合容器内的项目范围(相对于项目的宽度和厚度)。我试图表明,靠近“拟合范围”边缘的项目可能不如靠近图表中间的项目那么合适。为此,我想用绿色填充我的形状,它的渐变在边缘周围变成黄色。该黄色区域的整个内边缘周围的厚度应均匀,如下图所示。我怎样才能和拉斐尔一起完成这个任务呢?我知道如何进行实心填充;梯度是我遇到困难的地方。预先感谢您的帮助!

I have a dynamically generated graph that illustrates the range of items that will fit within a container, relative to the item's width and thickness. I'm trying to show that the items near the edge of the "fit range" might not be as good of a fit as those closer to the middle of the graph. To do this I'd like to fill my shape with green, which has a gradient that turns to yellow around the edges. This yellow area should be of uniform thickness around the entire inside edge, as illustrated in the image below. How might I accomplish this with Raphael? I know how to do a solid fill; the gradient is where I'm having difficulty. Thanks in advance for your help!

如果你对这篇内容有疑问,欢迎到本站社区发帖提问 参与讨论,获取更多帮助,或者扫码二维码加入 Web 技术交流群。

绑定邮箱获取回复消息
由于您还没有绑定你的真实邮箱,如果其他用户或者作者回复了您的评论,将不能在第一时间通知您!

发布评论
评论(3)
理论上,应该可以通过将图形切成四个三角形来做到这一点。
然后,每个三角形都可以用渐变填充,该渐变主要是纯色,但在一端是渐变色变成你的边缘颜色。通过在渐变上设置直角,您可以使其看起来只有图表上的边缘具有不同的颜色。
我使用以下代码创建了上面的矩形。
不过,您的情况会稍微复杂一些。您必须首先找到图形的中间才能将其切成三角形。然后您需要找到每个渐变的角度。
In theory it should be possible to do this by slicing the graph into four triangles.
Each triangle can then be filled with a gradient that is mostly your solid color but at one end it turns into your edge color. By setting the right angle on the gradient you can make it look like only the edges on the graph have a different color.
I've created the rectangle above using the following code.
Your case will be a bit more complex though. You will have to first find the middle of the graph to be able to slice it into triangles. Then you need to find the angle for each of the gradients.
晚上,
事情并不像看起来那么容易。可能是由于如何在 VML 中实现它的问题。
我能做的最好的事情就是在原始对象后面使用目标对象的稍大的克隆,然后在其上使用渐变填充。
我在这个小提琴中制作了一个示例
希望有帮助。
Evening,
It's not as easy as it looks like it should be. Probably due to an issue with how to implement it in VML.
The best I was able to do is to use a slightly larger clone of your target object behind the original, and then use a gradient fill on it.
I've made an example in this fiddle
Hope that helps.
您可以在重叠的椭圆上使用径向渐变,但这会留下相当大的黄色角
要找到对象的中心,请使用旧的 getBBox()
You could use a radial gradient on an overllying ellipse but that will leave a rather large corner of yellow
To find the centre of your object use good old getBBox()