我应该使用什么工具来查看客户端通过 AJAX 发生的 GET 和 POST 请求的详细信息?
我正在尝试通过 AJAX 模拟网页上发生的 POST。有没有一种工具可以记录 GET/POST 请求,以便我可以准确地看到浏览器发送的内容?
我使用 Firebug,但不确定该应用程序上是否有地方可以查看交易。
请让我知道解决此问题的最佳方法。
I am trying to simulate a POST that is occurring on a web page via AJAX. Is there a tool where I can log the GET/POST requests so I can see exactly what is being sent by my browser?
I use Firebug, but not sure if there is a place on that app where I can view the transactions.
Please let me know the best way to go about this.
如果你对这篇内容有疑问,欢迎到本站社区发帖提问 参与讨论,获取更多帮助,或者扫码二维码加入 Web 技术交流群。

绑定邮箱获取回复消息
由于您还没有绑定你的真实邮箱,如果其他用户或者作者回复了您的评论,将不能在第一时间通知您!


发布评论
评论(4)
在 Windows 上 Fiddler 可以在系统范围内观察/中断/记录/重放请求。
On Windows Fiddler can observe/break/record/replay requests system wide.
您可以使用 Firebug 控制台中的“网络”选项卡来查看所有事务以及响应和消息。请求数据。看看 - http://getfirebug.com/network
You can use the "Net" tab in firebug console to see all the transactions along with the response & request data. Take a look at - http://getfirebug.com/network
Chrome 的开发者工具内置了此功能。我使用的是 chrome 的 beta 通道,要查看信息,请右键单击页面并选择“检查元素”。
这将打开元素检查器,您可以在其中选择“网络”选项卡。到达那里后,刷新您的页面,它将跟踪所有网络活动,并允许您查看每个请求的完整事务。
Chrome's developer tools has this functionality built in. I'm using the beta channel of chrome, and to see the information, right click in your page and select "inspect element"
This will bring up the element inspecter, on which you can select the "Network" tab. Once there, refresh your page and it will track all network activity and allow you to see the full transaction of each request.
Firebug 当然提供了此信息...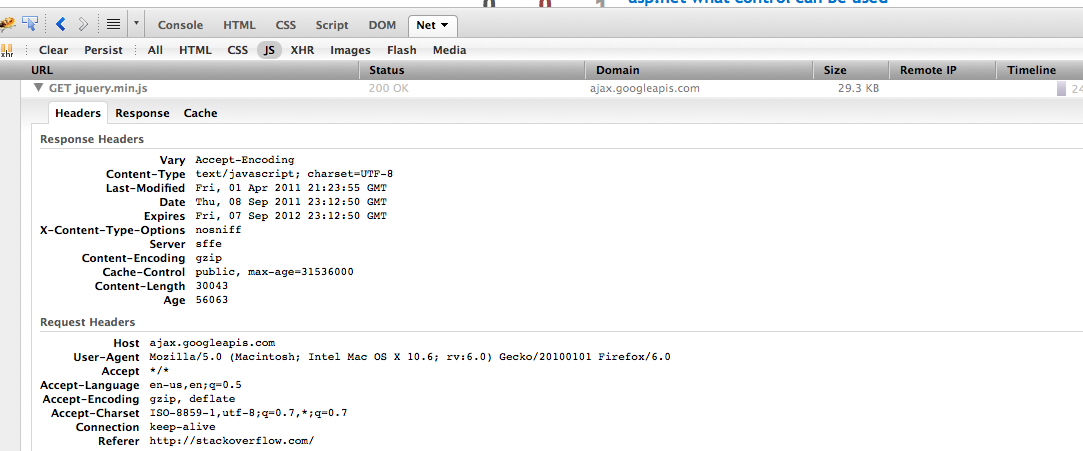
Firebug certainly provides this info...