使用 R 绘图将目录添加到 PDF
我正在 R 中创建大量绘图并将它们保存为 PDF(使用 grDevices / pdf)。有没有一种简单的方法可以在创建 PDF 时将(元数据)目录添加到 PDF 中?
我并不是想添加一个单独的页面,而是添加一个目录,像 Preview.app 这样的 PDF 查看器会在侧边栏中显示该目录,以便于导航。)
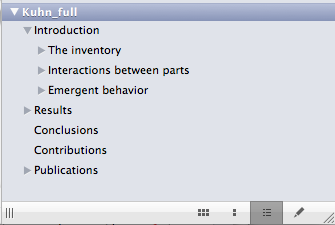
此类目录的示例:

I'm creating a larger number of plots in R and save them as PDF (using grDevices / pdf). Is there an easy way to add a (meta-data) table of contents to the PDF as it is created?
I don't mean to add a separate page, but a TOC that PDF viewers like Preview.app display in the sidebar to make navigation easier.)
Example of such a TOC:

如果你对这篇内容有疑问,欢迎到本站社区发帖提问 参与讨论,获取更多帮助,或者扫码二维码加入 Web 技术交流群。

绑定邮箱获取回复消息
由于您还没有绑定你的真实邮箱,如果其他用户或者作者回复了您的评论,将不能在第一时间通知您!

发布评论
评论(3)
我知道的唯一方法是使用 LaTeX,但你不一定需要 Sweave;也许您可以直接使用 RPython 代码生成 LaTeX 文件。如果您有两张 6x6(默认尺寸)的图片,分别名为
tmp-001.pdf和tmp-002.pdf,您可以按照以下方式制作称为 A 部分的部分,其中包含两张图片的两个小部分。The only way I know is with LaTeX, but you don't necessarily need Sweave; perhaps you could just generate the LaTeX file directly with your RPython code. If you've got two pictures which are 6x6 (the default size) named
tmp-001.pdfandtmp-002.pdf, this is how you'd make a section called Section A with two subsections for the two pictures.您可以使用对象或绘图的名称作为列中文本的参数来创建第一页。
我想不出一种方法来生成可导航的目录,但这个选项可能更令人愉快并且更容易集成带有投影仪类型的显示器。 Hmisc 包函数 Latex 提供了 Latex longtable 包的接口。我的 Latex-fu 很弱,但如果你的更强大,你也可以转移为集成到其他应用程序中而创建的 dvi 代码。我将一个中间 dvi 文件放入临时目录中,然后打开我的 dvi 查看器并允许另存为 pdf:
You could create a first page using the names of your objects or plots as the arguments to text in columns.
I cannot think of a way to generate a navigable TOC, but this option may be more pleasing and easier to integrate with Beamer-type displays. The Hmisc package function latex provides an interface to the Latex longtable package. My Latex-fu is weak but if yours is stronger, you could also divert the dvi code that is created for integration within other applications. I get an intermediate dvi file put in a temporary directory which then opens my dvi viewer and allows saving as pdf:
据我所知还没有。我认为你必须使用 sweave 来实现这一点。
Not as far as I know. I think you have to use sweave for that.