数学中的插值
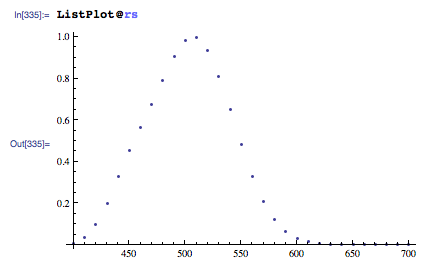
请考虑以下分布:
rs={{400, 0.00929}, {410, 0.0348}, {420, 0.0966}, {430, 0.2}, {440, 0.328}, {450, 0.455},
    {460, 0.567}, {470, 0.676}, {480, 0.793}, {490, 0.904}, {500, 0.982}, {510, 0.997},
    {520,0.935}, {530, 0.811}, {540, 0.65}, {550, 0.481}, {560, 0.329}, {570,0.208},
    {580, 0.121}, {590, 0.0655}, {600, 0.0332}, {610, 0.0159}, {620, 0.00737},
    {630, 0.00334}, {640, 0.0015}, {650,0.000677}, {660, 0.000313}, {670, 0.000148},
    {680, 0.0000715}, {690,0.0000353}, {700, 0.0000178}}

我如何插值此分布以获得图像上任何位置的点的值X 轴?
Please consider the following distribution :
rs={{400, 0.00929}, {410, 0.0348}, {420, 0.0966}, {430, 0.2}, {440, 0.328}, {450, 0.455},
    {460, 0.567}, {470, 0.676}, {480, 0.793}, {490, 0.904}, {500, 0.982}, {510, 0.997},
    {520,0.935}, {530, 0.811}, {540, 0.65}, {550, 0.481}, {560, 0.329}, {570,0.208},
    {580, 0.121}, {590, 0.0655}, {600, 0.0332}, {610, 0.0159}, {620, 0.00737},
    {630, 0.00334}, {640, 0.0015}, {650,0.000677}, {660, 0.000313}, {670, 0.000148},
    {680, 0.0000715}, {690,0.0000353}, {700, 0.0000178}}

How could I interpolate this distribution to obtain value for points at any location on the X Axis ?
如果你对这篇内容有疑问,欢迎到本站社区发帖提问 参与讨论,获取更多帮助,或者扫码二维码加入 Web 技术交流群。

绑定邮箱获取回复消息
由于您还没有绑定你的真实邮箱,如果其他用户或者作者回复了您的评论,将不能在第一时间通知您!

发布评论
评论(3)
只需使用标准
Interpolation函数:如果您想拟合特定类别的函数 (例如正态分布),而是使用 FindFit。
Just use the standard
Interpolationfunction:If you want to fit a specific class of functions (such as a normal distribution), instead use
FindFit.如果您需要良好的导数,您可以执行以下操作:
描述">
If you need nice derivatives, you may do something like:
Look at the difference in the derivative's behavior when you use the "Spline" Method:
如果它是一个发行版,我认为你应该使用 SmoothKernelDistribution 代替。
If it is a distribution, I think you should use SmoothKernelDistribution instead.