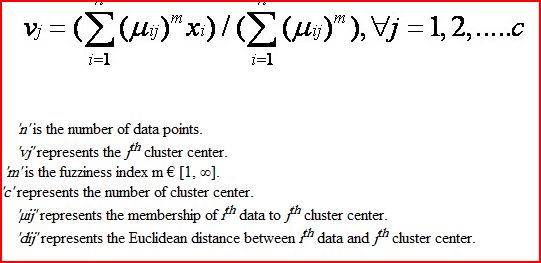
模糊 c- 表示分类数据
模糊 c 均值能否应用于非数值数据集?即分类或混合数字和分类.. 如果是(我希望如此:():
- 我们如何计算聚类中心?
如果否,替代方案是什么..如何对这些数据进行模糊聚类?
我需要响应,请帮助
注意:我已经使用 Jacard 系数来计算2点之间的距离,但仍然没有找到计算聚类中心的方法,请参阅附件

Can the fuzzy c-means applied on non numerical data sets ? i.e categorical or mixed numerical and categorical..
if yes (I hope so :( ):
- how we calculate cluster centers ?
If NO , what is the alternative .. how to fuzzy clusters these data ?
I need the response please help
NOTE: I've used the Jacard's coefficient to calculate the distance between 2 points but still didn't get the way to calculate the cluster centers see the attachements

如果你对这篇内容有疑问,欢迎到本站社区发帖提问 参与讨论,获取更多帮助,或者扫码二维码加入 Web 技术交流群。

绑定邮箱获取回复消息
由于您还没有绑定你的真实邮箱,如果其他用户或者作者回复了您的评论,将不能在第一时间通知您!

发布评论
评论(1)
您必须将数据转换为数字形式。有多种方法可以做到这一点,其中两种是:
两者都是许多机器学习程序在幕后进行的非常常见的转换。此外,您可能想尝试一种与欧几里得度量不同的度量。特别是。使用 one-hot 表示,但根据数据,L1 范数(曼哈顿/城市街区距离)可能更合适。
除此之外,只需将给定的公式应用于转换后的数据集即可。
You'll have to transform your data into a numeric form. There are various ways of doing that, two of them being:
Both are very common transformations that many machine learning programs do under the hood. Also, you might want to experiment with a different metric than the Euclidean one. Esp. with one-hot representation, but depending on the data, the L1 norm (Manhattan/city block distance) may be more appropriate.
Apart from that, just apply the given formulas to your transformed dataset.