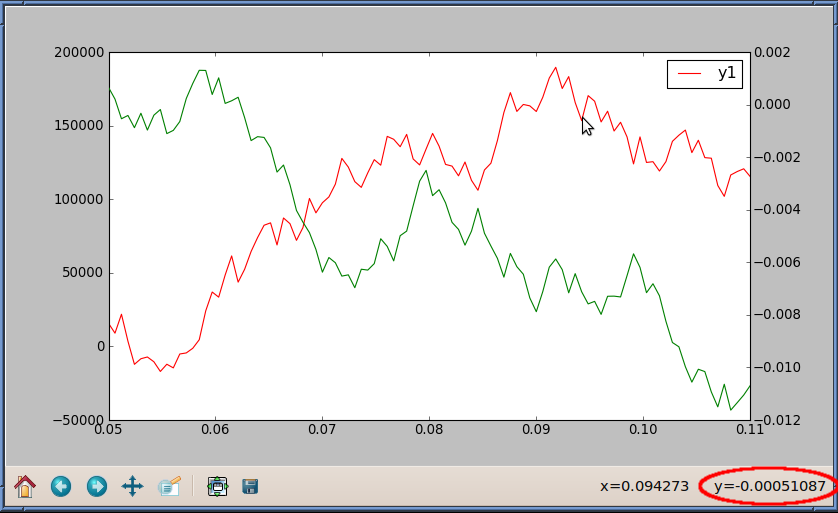
使用 twinx 时控制跟踪器

右下角的跟踪器(以红色突出显示)报告相对于 y- 的 y 值轴在右侧。
如何让跟踪器报告相对于左侧 y 轴的 y 值?
import matplotlib.pyplot as plt
import numpy as np

np.random.seed(6)
numdata = 100
t = np.linspace(0.05, 0.11, numdata)
y1 = np.cumsum(np.random.random(numdata) - 0.5) * 40000
y2 = np.cumsum(np.random.random(numdata) - 0.5) * 0.002

fig = plt.figure()

ax1 = fig.add_subplot(111)
ax2 = ax1.twinx()

ax1.plot(t, y1, 'r-', label='y1')
ax2.plot(t, y2, 'g-', label='y2')

ax1.legend()
plt.show()
我知道将 y1 与 y2 交换将使跟踪器报告 y1 值, 但这也会将 y1 刻度线放在右侧,这不是我想要发生的情况。
ax1.plot(t, y2, 'g-', label='y2')
ax2.plot(t, y1, 'r-', label='y1')

The tracker in the lower-right corner (highlighted in red) reports y-values relative to the y-axis on the right.
How can I get the tracker to report y-values relative to the y-axis on the left instead?
import matplotlib.pyplot as plt
import numpy as np

np.random.seed(6)
numdata = 100
t = np.linspace(0.05, 0.11, numdata)
y1 = np.cumsum(np.random.random(numdata) - 0.5) * 40000
y2 = np.cumsum(np.random.random(numdata) - 0.5) * 0.002

fig = plt.figure()

ax1 = fig.add_subplot(111)
ax2 = ax1.twinx()

ax1.plot(t, y1, 'r-', label='y1')
ax2.plot(t, y2, 'g-', label='y2')

ax1.legend()
plt.show()
I know swapping y1 with y2 will make the tracker report y1-values,
but this also places the y1 tickmarks on the right-hand side, which is not what I want to happen.
ax1.plot(t, y2, 'g-', label='y2')
ax2.plot(t, y1, 'r-', label='y1')
如果你对这篇内容有疑问,欢迎到本站社区发帖提问 参与讨论,获取更多帮助,或者扫码二维码加入 Web 技术交流群。

绑定邮箱获取回复消息
由于您还没有绑定你的真实邮箱,如果其他用户或者作者回复了您的评论,将不能在第一时间通知您!

发布评论
评论(2)
啊,找到了:
ax.yaxis.set_ticks_position("right")。您可以交换 y 轴的位置,而不是尝试“控制跟踪器”。
AFAIK,当使用
twinx时,跟踪器始终遵循ax2。Ah, found it:
ax.yaxis.set_ticks_position("right").Instead of trying to "control the tracker", you can swap the location of the y-axes.
AFAIK, the tracker always follows
ax2when usingtwinx.请注意,如果您在 ax1 和 ax2 之后创建一个
ax3= ax1.twiny()轴,则跟踪器将转到 ax3 并且您将再次报告 y1 值。Please note that if you create an
ax3= ax1.twiny()axes after ax1 and ax2, the tracker goes to ax3 and you have again it reporting y1 values.