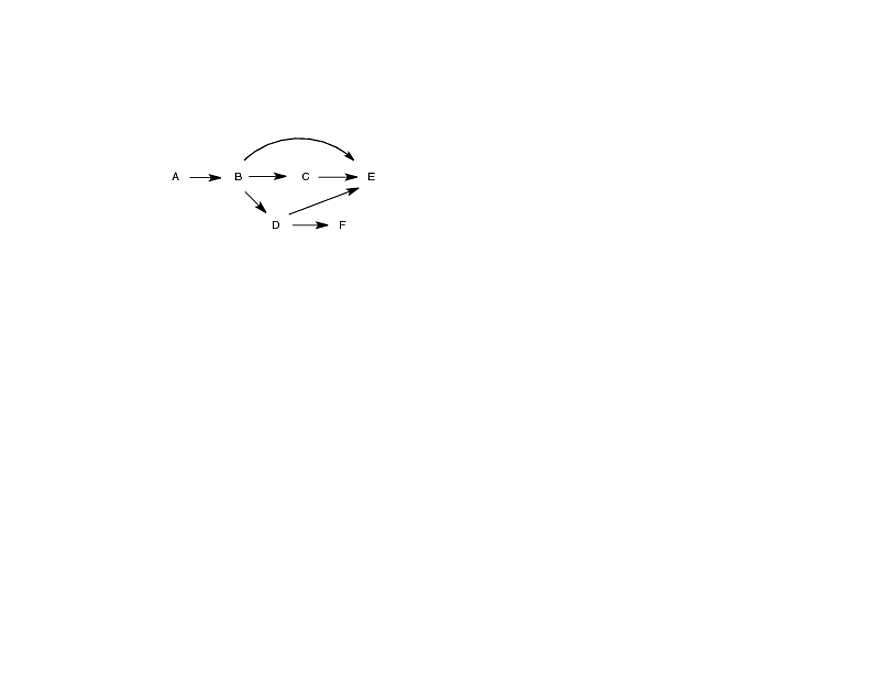
食物网中的营养位置/高度(遵循网络中的路径)
作为为我正在开发的包开发演示的一部分,我需要量化经典的生态食物网,如下所述。我已经检查过纯素、双向和 sna,但没有看到任何能满足我需要的东西,尽管我可能是错的 - 这些都是大包。因此,我想知道这个想法是否已经包含在包中,或者是否有人有一个聪明的方法来计算结果。看起来应该是一个包。
食物网可以通过物种 A:F 之间的相互作用矩阵来描述,如代码和图表所示。用语言来说,人们会说“A吃B,B又吃E”等等(在矩阵中很难看出,在图中微不足道)。
species <- LETTERS[1:6]

links <- c(0, 1, 0, 0, 0, 0,
    1, 0, 1, 1, 1, 0,
    0, 1, 0, 0, 1, 0,
    0, 1, 0, 0, 1, 1,
    0, 1, 1, 1, 0, 0,
    0, 0, 0, 1, 0, 0)

L <- matrix(links, nrow = 6, byrow = TRUE,
    dimnames = list(species, species))
我想计算每个物种的营养位置和营养高度。营养级位置定义为食物链中特定物种以下的物种总数 + 1。在图中,A 的营养级位置为 6,D 的营养级位置为 3。另一方面,营养级高度是平均值物种在其参与的每个单独链中的位置。物种B连接到4条不同的链(路径);它的高度是一次考虑的位置的平均值:(3 + 3 + 3 + 2)/4 = 2.75。
在计算上,需要读取矩阵 L,然后通过矩阵隐含的不同路径来计算所需的值。
如果这不是太迟钝,有谁知道一个可以做到这一点的包,或者找到一种遵循路径并计算各种长度/选项的方法?它“感觉”好像必须有一些递归/应用方法应该有效,但我不想重新发明东西。
提前致谢

As part of developing a demo for a package I'm working on, I need to quantify a classic ecological food web as described below. I have checked out vegan, bipartite and sna but don't see anything that does what I need, though I could be wrong - those are big packages. Thus I'm wondering if this idea is already in package, or if someone has a clever way to compute the results. Seems like it should be a package.
A food web can be described by a matrix of interactions between species A:F, as shown in the code and diagram. In words, one would say that "A eats B which eats E" etc (very hard to see in the matrix, trivial in the diagram).
species <- LETTERS[1:6]

links <- c(0, 1, 0, 0, 0, 0,
    1, 0, 1, 1, 1, 0,
    0, 1, 0, 0, 1, 0,
    0, 1, 0, 0, 1, 1,
    0, 1, 1, 1, 0, 0,
    0, 0, 0, 1, 0, 0)

L <- matrix(links, nrow = 6, byrow = TRUE,
    dimnames = list(species, species))
I want to compute the trophic position and the trophic height of each species. Trophic position is defined as the total number of species the in the food chain below a particular species + 1. In the diagram, the trophic position of A is 6 and for D it is 3. On the other hand, trophic height is the average of the position of a species in each separate chain in which it participates. Species B is connected to 4 different chains (paths); it's height is the average of the positions considered one at at time: (3 + 3 + 3 + 2)/4 = 2.75.
Computationally, one needs to read the matrix L, then work through the different paths implied by the matrix to compute the needed values.
If this is not too obtuse, does anyone know a package that will do this, or see a way to follow the paths and compute on the various lengths/options? It "feels" like there must be some recursive/apply approach that should work, but I don't want to reinvent stuff.
Thanks in Advance

如果你对这篇内容有疑问,欢迎到本站社区发帖提问 参与讨论,获取更多帮助,或者扫码二维码加入 Web 技术交流群。

绑定邮箱获取回复消息
由于您还没有绑定你的真实邮箱,如果其他用户或者作者回复了您的评论,将不能在第一时间通知您!

发布评论
评论(2)
这是经典的图论内容。你所拥有的是一个有向图,其中动物是节点,“A 吃 B”是边。那么你的矩阵就是一个对边进行编码的邻接矩阵(但你可能希望矩阵的一半为0,所以你不会让A吃B而B吃A。类似地,对角线上的零,除非你有同类相食行为)。这是另一个答案中链接的有向无环图。
图论包在图形模型任务视图中列出:
http://ftp.heanet.ie/mirrors/cran.r-project.org/web/views/gR.html
我认为 igraph 会做你想做的。首先从你的矩阵中创建一个图形对象(使用仅包含上三角形的修改后的矩阵):
然后你可以使用neighborhood.size来获取营养位置:
其顺序应该是A,B,C,D,E,F。请注意,使用 Inf 来停止限制邻域,并使用 mode="out" 来仅沿着吃的方向遵循图形边缘。
所有关于食物链的讨论都让我感到饥饿。希望这能让你开始。
巴里
This is classic graph theory stuff. What you have is a directed graph, where animals are nodes and 'A eats B' is an edge. Your matrix is then an adjacency matrix encoding the edges (but you probably want half of the matrix to be 0s, so you don't have A eats B and B eats A. Similarly, zeroes on the diagonal unless you have cannibalistic behaviour). This is a directed acyclic graph as linked in another answer.
Packages for graph theory are listed in the graphical models Task View:
http://ftp.heanet.ie/mirrors/cran.r-project.org/web/views/gR.html
and I think igraph will do what you want. First make a graph object from your matrix (using the modified matrix with only the upper triangle):
Then you can use neighborhood.size to get the trophic position:
which should be in order A,B,C,D,E,F. Note use of Inf to stop limiting the neighbourhood, and the use of mode="out" to only follow the graph edges in the direction of the eating.
All this talk of food chains is making me hungry. Hope that gets you started.
Barry
这是计算您所追求的营养高度的一种方法。
假设矩阵
L编码 DAG ,其中从每行中的物种到每列中的物种的链接。L_(i,j)=1表示 spp_i 吃 spp_j。那么
L*L表示连接每对物种的两步“营养路径”的数量,L*L*L包含三步路径的数量,等等在。在它们之间,“矩阵幂”集记录了连接节点对的所有路径,无论长度如何。根据您的描述,一个物种的营养高度是一加上将其连接到图表尖端的“叶节点”之一的所有路径的平均路径长度。
此函数(使用
expm包中的运算符)应该可以满足您的要求。它可以做一些更详细的评论,但如果我有时间,我会在稍后添加。Here is one approach to calculating the trophic heights you're after.
Let's say that matrix
Lencodes a DAG with links FROM the species in each row TO the species in each column.L_(i,j)=1indicates that spp_i eats spp_j.Then
L*Lexpresses the number of two-step 'trophic paths' connecting each pair of species,L*L*Lcontains the number of three step paths, and so on. Between them, the set of 'matrix powers' records all paths, of whatever length, connecting pairs of nodes.From your description, a species' trophic height is one plus the average path length of all the paths that connect it to one of the 'leaf nodes' at the tips of the graph.
This function (which uses an operator in the
expmpackage) should do what you are looking for. It could do with some more detailed commenting, but I'll add that later if I have the time.