是否可以更新 R 中的格子面板?
格子图的更新方法允许在初始调用后修改格子图。但更新行为更像是替换而不是追加。这与 ggplot2 习惯用法不同,其中每个新图层都是对现有图层的附加。是否有可能使用lattice获得这种附加行为?
示例:
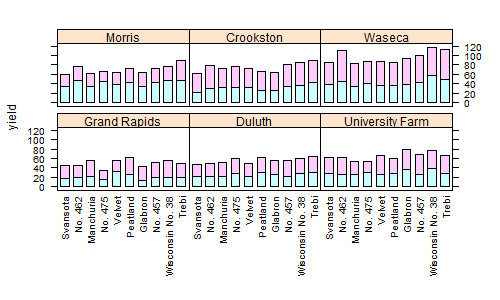
LL <- barchart(yield ~ variety | site, data = barley,
        groups = year, stack = TRUE,
        between=list(y=0.5),
        scales = list(x = list(rot = 90)))
print(LL)

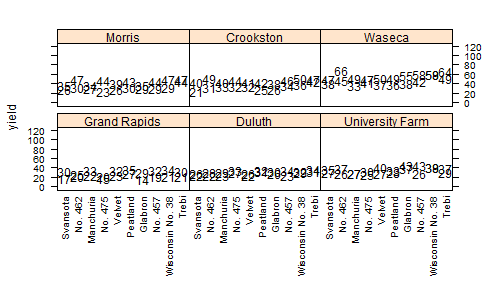
现在我想将 panel.text 添加到现有绘图中。按以下方式使用 update 不起作用:
update(LL, panel=function(...){
           args <- list(...); panel.text(args$x, args$y+2, round(args$y, 0))
         })

我知道我可以通过指定面板函数中的所有图层来使用更新:
update(LL, panel=function(...){
           args <- list(...)
           panel.barchart(...)
           panel.text(args$x, args$y+2, round(args$y, 0))
         })
这可以工作,但要求我知道格子图中已有的内容 - 或者我重构我的代码相当多。
问题:有没有办法添加到update.trellis中的现有面板?
The update method of trellis plots allows one to modify a lattice plot after the initial call. But the update behaviour is more like replace than append. This differs from the ggplot2 idiom where each new layer is additive to what exists already. Is it possible to get this additive behaviour using lattice?
An example:
LL <- barchart(yield ~ variety | site, data = barley,
        groups = year, stack = TRUE,
        between=list(y=0.5),
        scales = list(x = list(rot = 90)))
print(LL)

Now I want to add panel.text to the existing plot. Using update in the following way doesn't work:
update(LL, panel=function(...){
           args <- list(...); panel.text(args$x, args$y+2, round(args$y, 0))
         })

I know that I can use update by specifying all of the layers in the panel function:
update(LL, panel=function(...){
           args <- list(...)
           panel.barchart(...)
           panel.text(args$x, args$y+2, round(args$y, 0))
         })
This will work, but requires that I know what is already in the lattice plot - or that I refactor my code quite substantially.
Question: Is there a way of adding to the existing panel in update.trellis?
如果你对这篇内容有疑问,欢迎到本站社区发帖提问 参与讨论,获取更多帮助,或者扫码二维码加入 Web 技术交流群。

绑定邮箱获取回复消息
由于您还没有绑定你的真实邮箱,如果其他用户或者作者回复了您的评论,将不能在第一时间通知您!

发布评论
评论(2)
请参阅
latticeExtra< 中的layer/code>包。See
layerfrom thelatticeExtrapackage.这是一种无需latticeExtra即可实现的方法。不可否认,它比latticeExtra 路线更复杂、更困难。但是,此
trellis.focus方法的灵活性在其他上下文中可能更有用。Here is a way to do it without
latticeExtra. Admittedly, it's more complicated and difficult than thelatticeExtraroute. However, the flexibility with thistrellis.focusmethod might be more useful in other contexts.