如何在 scipy 创建的树状图中获得与颜色簇相对应的平面聚类

发布于 2024-12-08 04:30:07 字数 956 浏览 5 评论 0 原文

使用发布的代码 在这里,我创建了一个很好的层次聚类:
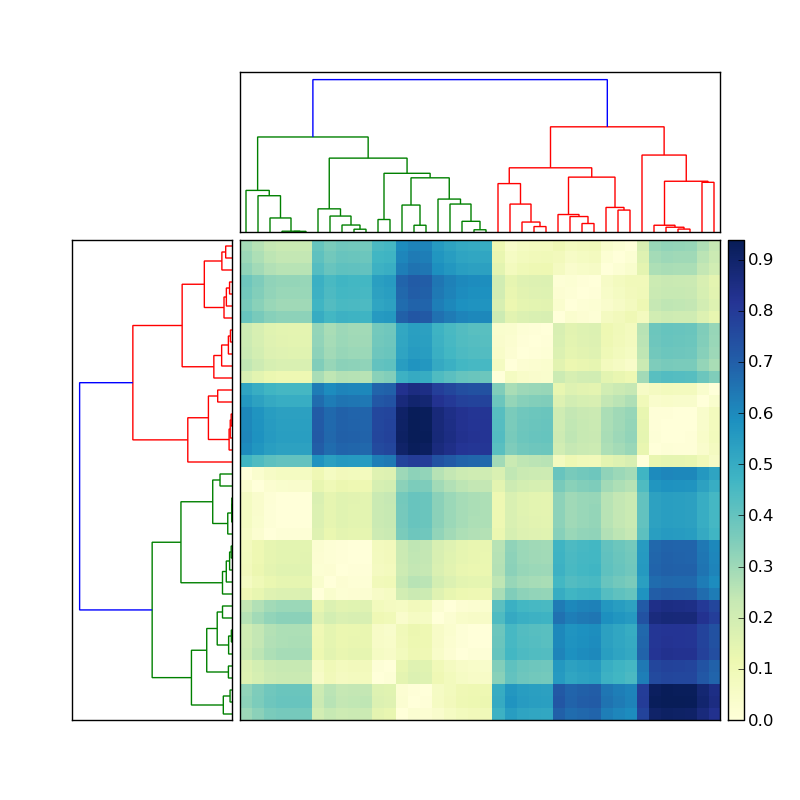
scipy dendrogram

假设左侧的树状图是通过执行以下操作创建的

Y = sch.linkage(D, method='average') # D is a distance matrix
cutoff = 0.5*max(Y[:,2])
Z = sch.dendrogram(Y, orientation='right', color_threshold=cutoff)

:现在如何获取每个彩色簇的成员的索引? 为了简化这种情况,忽略顶部的聚类,仅关注矩阵左侧的树状图。

此信息应存储在树状图 Z 存储变量中。有一个函数应该可以做我想要的事情,称为fcluster(请参阅文档此处)。但是,我看不到在哪里可以为 fcluster 提供与我在创建树状图时指定的相同的 cutoff。看来 fcluster 中的阈值变量,t 必须根据各种模糊的测量值(不一致不一致,距离>、maxclustmonocrit)。有什么想法吗?

Using the code posted here, I created a nice hierarchical clustering:

scipy dendrogram

Let's say the the dendrogram on the left was created by doing something like

Y = sch.linkage(D, method='average') # D is a distance matrix
cutoff = 0.5*max(Y[:,2])
Z = sch.dendrogram(Y, orientation='right', color_threshold=cutoff)

Now how do I get the indices of the members of each of the colored clusters? To simplify this situation, ignore the clustering on the top, and focus only on the dendrogram on the left of the matrix.

This information should be stored in the dendrogram Z stored variable. There is a function that should do just what I want called fcluster (see documentation here). However I cannot see where I can give fcluster the same cutoff as I specified in the creation of the dendrogram. It seems that the threshold variable in fcluster, t has to be in terms of various obscure measurements (inconsistent, distance, maxclust, monocrit). Any ideas?

如果你对这篇内容有疑问,欢迎到本站社区发帖提问 参与讨论,获取更多帮助,或者扫码二维码加入 Web 技术交流群。

扫码二维码加入Web技术交流群

发布评论

需要 登录 才能够评论, 你可以免费 注册 一个本站的账号。

评论(4

離人涙 2024-12-15 04:30:07

我认为你走在正确的道路上。让我们试试这个:

import scipy
import scipy.cluster.hierarchy as sch
X = scipy.randn(100, 2)     # 100 2-dimensional observations
d = sch.distance.pdist(X)   # vector of (100 choose 2) pairwise distances
L = sch.linkage(d, method='complete')
ind = sch.fcluster(L, 0.5*d.max(), 'distance')

ind 将为您提供 100 个输入观测值中每个观测值的聚类索引。 ind 取决于您在 linkage 中使用的方法。尝试 method=singlecompleteaverage。然后注意 ind 有何不同。

示例:

In [59]: L = sch.linkage(d, method='complete')

In [60]: sch.fcluster(L, 0.5*d.max(), 'distance')
Out[60]: 
array([5, 4, 2, 2, 5, 5, 1, 5, 5, 2, 5, 2, 5, 5, 1, 1, 5, 5, 4, 2, 5, 2, 5,
       2, 5, 3, 5, 3, 5, 5, 5, 5, 5, 5, 5, 2, 2, 5, 5, 4, 1, 4, 5, 2, 1, 4,
       2, 4, 2, 2, 5, 5, 5, 2, 5, 5, 3, 5, 5, 4, 5, 4, 5, 3, 5, 3, 5, 5, 5,
       2, 3, 5, 5, 4, 5, 5, 2, 2, 5, 2, 2, 4, 1, 2, 1, 5, 2, 5, 5, 5, 1, 5,
       4, 2, 4, 5, 2, 4, 4, 2])

In [61]: L = sch.linkage(d, method='single')

In [62]: sch.fcluster(L, 0.5*d.max(), 'distance')
Out[62]: 
array([1, 1, 1, 1, 1, 1, 1, 1, 1, 1, 1, 1, 1, 1, 1, 1, 1, 1, 1, 1, 1, 1, 1,
       1, 1, 1, 1, 1, 1, 1, 1, 1, 1, 1, 1, 1, 1, 1, 1, 1, 1, 1, 1, 1, 1, 1,
       1, 1, 1, 1, 1, 1, 1, 1, 1, 1, 1, 1, 1, 1, 1, 1, 1, 1, 1, 1, 1, 1, 1,
       1, 1, 1, 1, 1, 1, 1, 1, 1, 1, 1, 1, 1, 1, 1, 1, 1, 1, 1, 1, 1, 1, 1,
       1, 1, 1, 1, 1, 1, 1, 1])

scipy.cluster.hierarchy 确实令人困惑。在你的链接中,我什至不认识我自己的代码!

I think you're on the right track. Let's try this:

import scipy
import scipy.cluster.hierarchy as sch
X = scipy.randn(100, 2)     # 100 2-dimensional observations
d = sch.distance.pdist(X)   # vector of (100 choose 2) pairwise distances
L = sch.linkage(d, method='complete')
ind = sch.fcluster(L, 0.5*d.max(), 'distance')

ind will give you cluster indices for each of the 100 input observations. ind depends on what method you used in linkage. Try method=single, complete, and average. Then note how ind differs.

Example:

In [59]: L = sch.linkage(d, method='complete')

In [60]: sch.fcluster(L, 0.5*d.max(), 'distance')
Out[60]: 
array([5, 4, 2, 2, 5, 5, 1, 5, 5, 2, 5, 2, 5, 5, 1, 1, 5, 5, 4, 2, 5, 2, 5,
       2, 5, 3, 5, 3, 5, 5, 5, 5, 5, 5, 5, 2, 2, 5, 5, 4, 1, 4, 5, 2, 1, 4,
       2, 4, 2, 2, 5, 5, 5, 2, 5, 5, 3, 5, 5, 4, 5, 4, 5, 3, 5, 3, 5, 5, 5,
       2, 3, 5, 5, 4, 5, 5, 2, 2, 5, 2, 2, 4, 1, 2, 1, 5, 2, 5, 5, 5, 1, 5,
       4, 2, 4, 5, 2, 4, 4, 2])

In [61]: L = sch.linkage(d, method='single')

In [62]: sch.fcluster(L, 0.5*d.max(), 'distance')
Out[62]: 
array([1, 1, 1, 1, 1, 1, 1, 1, 1, 1, 1, 1, 1, 1, 1, 1, 1, 1, 1, 1, 1, 1, 1,
       1, 1, 1, 1, 1, 1, 1, 1, 1, 1, 1, 1, 1, 1, 1, 1, 1, 1, 1, 1, 1, 1, 1,
       1, 1, 1, 1, 1, 1, 1, 1, 1, 1, 1, 1, 1, 1, 1, 1, 1, 1, 1, 1, 1, 1, 1,
       1, 1, 1, 1, 1, 1, 1, 1, 1, 1, 1, 1, 1, 1, 1, 1, 1, 1, 1, 1, 1, 1, 1,
       1, 1, 1, 1, 1, 1, 1, 1])

scipy.cluster.hierarchy sure is confusing. In your link, I don't even recognize my own code!

与往事干杯 2024-12-15 04:30:07

我编写了一些代码来解压缩链接矩阵。它返回一个字典,其中包含按每个聚合步骤分组的标签索引。我只在complete链接集群的结果上进行了尝试。字典的键从 len(labels)+1 开始,因为最初,每个标签都被视为自己的簇。这可能会回答你的问题。

import pandas as pd
import numpy as np
from scipy.cluster.hierarchy import linkage

np.random.seed(123)
labels = ['ID_0','ID_1','ID_2','ID_3','ID_4']

X = np.corrcoef(np.random.random_sample([5,3])*10)
row_clusters = linkage(x_corr, method='complete')    

def extract_levels(row_clusters, labels):
    clusters = {}
    for row in xrange(row_clusters.shape[0]):
        cluster_n = row + len(labels)
        # which clusters / labels are present in this row
        glob1, glob2 = row_clusters[row, 0], row_clusters[row, 1]

        # if this is a cluster, pull the cluster
        this_clust = []
        for glob in [glob1, glob2]:
            if glob > (len(labels)-1):
                this_clust += clusters[glob]
            # if it isn't, add the label to this cluster
            else:
                this_clust.append(glob)

        clusters[cluster_n] = this_clust
    return clusters

返回:

{5: [0.0, 2.0],
 6: [3.0, 4.0],
 7: [1.0, 0.0, 2.0],
 8: [3.0, 4.0, 1.0, 0.0, 2.0]}

I wrote some code to decondense the linkage matrix. It returns a dictionary containing the indexes of labels that are grouped by each agglomeration step. I've only tried it out on the results of the complete linkage clusters. The keys of the dict start at len(labels)+1 because initially, each label is treated as its own cluster. This may answer your question.

import pandas as pd
import numpy as np
from scipy.cluster.hierarchy import linkage

np.random.seed(123)
labels = ['ID_0','ID_1','ID_2','ID_3','ID_4']

X = np.corrcoef(np.random.random_sample([5,3])*10)
row_clusters = linkage(x_corr, method='complete')    

def extract_levels(row_clusters, labels):
    clusters = {}
    for row in xrange(row_clusters.shape[0]):
        cluster_n = row + len(labels)
        # which clusters / labels are present in this row
        glob1, glob2 = row_clusters[row, 0], row_clusters[row, 1]

        # if this is a cluster, pull the cluster
        this_clust = []
        for glob in [glob1, glob2]:
            if glob > (len(labels)-1):
                this_clust += clusters[glob]
            # if it isn't, add the label to this cluster
            else:
                this_clust.append(glob)

        clusters[cluster_n] = this_clust
    return clusters

Returns:

{5: [0.0, 2.0],
 6: [3.0, 4.0],
 7: [1.0, 0.0, 2.0],
 8: [3.0, 4.0, 1.0, 0.0, 2.0]}
万劫不复 2024-12-15 04:30:07

我知道这对游戏来说已经很晚了,但是我根据帖子 此处。它已在 pip 上注册,因此要安装,您只需调用

pip install pydendroheatmap

此处查看该项目的 github 页面:https://github。 com/themantalope/pydendroheatmap

I know this is very late to the game, but I made a plotting object based on the code from the post here. It's registered on pip, so to install you just have to call

pip install pydendroheatmap

check out the project's github page here : https://github.com/themantalope/pydendroheatmap

因为看清所以看轻 2024-12-15 04:30:07

您还可以尝试 cut_tree,它有一个高度参数,可以为您提供超测量所需的信息。

You can also try cut_tree, it has a height parameter that should give you what you want for ultrametrics.

~没有更多了~
我们使用 Cookies 和其他技术来定制您的体验包括您的登录状态等。通过阅读我们的 隐私政策 了解更多相关信息。 单击 接受 或继续使用网站,即表示您同意使用 Cookies 和您的相关数据。
原文