在三角形上使用 3D 等值线图绘制曲面
rgl 的示例代码 几乎可以满足我的要求。然而,我的 (x,y) 不在矩形中,而是在矩形一半的三角形中(x=0..1,y=0..1,如果 x+y>1,则缺少 z)。
我的输入数据集采用以下格式:
x1 x2 x3 x4 x5 x6 z
,我想可视化(x4,x5,z)和(x2,x3,x6)等。如果如何在 R 中执行此操作,请提供任何帮助,我是初学者。
可以将最终绘图导出为 PDF、EPS 或 SVG 吗?
更新:好的,我看到我可以导出为 EPS。
更新2:多亏了卡尔,我几乎得到了我想要的东西。 
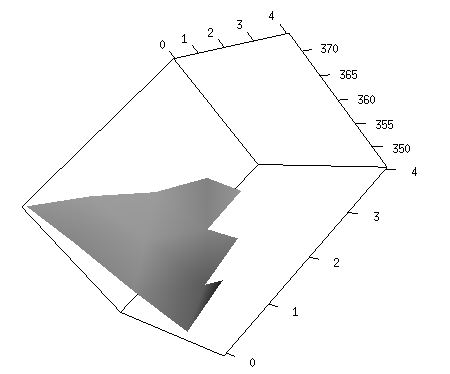
唯一的问题是表面的边缘之一是锯齿状的。在齿之间,其中x+y≤4,应当保留表面,使得锯齿状边缘变得像其他边缘一样。我该怎么做?
R代码如下,输入数据在这里
library(rgl)
mat = matrix(scan("bpexamp.out"),ncol=9,byrow=T)
N <- 4
x <- c(0:N)
y <- c(0:N)
z <- mat[,9]
zlim <- range(y)
zlen <- zlim[2] - zlim[1] + 1
colorlut <- terrain.colors(zlen,alpha=0) # height color lookup table
col <- colorlut[ z-zlim[1]+1 ] # assign colors to heights for each point
open3d()
aspect3d(1,1,0.1)
surface3d(x, y, z, col)
axes3d()
The example code here for rgl does almost what I want. However my (x,y) are not in a rectangle but in a triangle that is half of the rectangle (x=0..1, y=0..1 and z is missing if x+y>1).
My input dataset is in the following format:
x1 x2 x3 x4 x5 x6 z
and I would like to visualize (x4, x5, z) and (x2, x3, x6), etc. Any help is appreciated how to do this in R, I am beginner.
Can export the final plot into PDF, EPS or SVG?
UPDATE: OK, I see I can export to EPS.
UPDATE 2: Thanks to Carl I almost got what I want.
The only problem is that one of the edges of the surface is saw-toothed. Between the teeth, where x+y<=4 the surface should be kept so the saw-toothed edge becomes like the other edges. How can I do this?
The R code is below, the input data is here
library(rgl)
mat = matrix(scan("bpexamp.out"),ncol=9,byrow=T)
N <- 4
x <- c(0:N)
y <- c(0:N)
z <- mat[,9]
zlim <- range(y)
zlen <- zlim[2] - zlim[1] + 1
colorlut <- terrain.colors(zlen,alpha=0) # height color lookup table
col <- colorlut[ z-zlim[1]+1 ] # assign colors to heights for each point
open3d()
aspect3d(1,1,0.1)
surface3d(x, y, z, col)
axes3d()
如果你对这篇内容有疑问,欢迎到本站社区发帖提问 参与讨论,获取更多帮助,或者扫码二维码加入 Web 技术交流群。

绑定邮箱获取回复消息
由于您还没有绑定你的真实邮箱,如果其他用户或者作者回复了您的评论,将不能在第一时间通知您!

发布评论
评论(1)
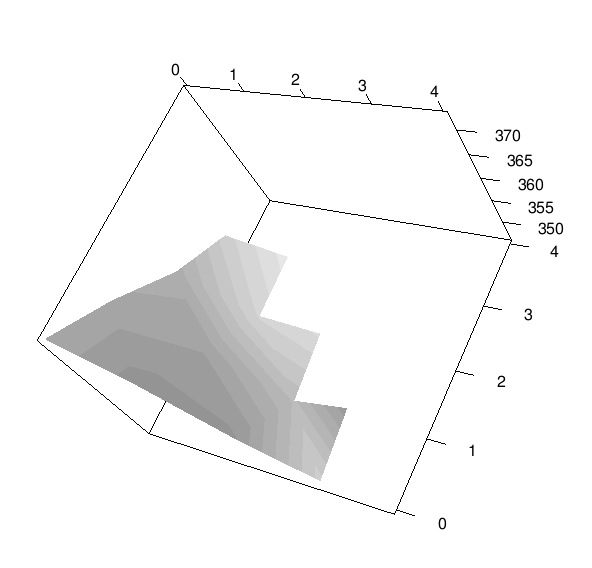
这是一条评论 - 但我不知道如何将图像放入评论中,因此将其格式化为答案。我跑了你的东西并得到了这张图表:
我跑了你的东西并得到了这个图表:
那么,这里缺少或不准确的是什么?我们也许可以为您“修复”它......
This is a comment - but I don't know howto put an image into a comment, so formatted as an answer. I ran yr stuff and got this chart:
I ran yr stuff and got this chart:
So, what is missing or inaccurate here? We can probably 'fix' it for you...