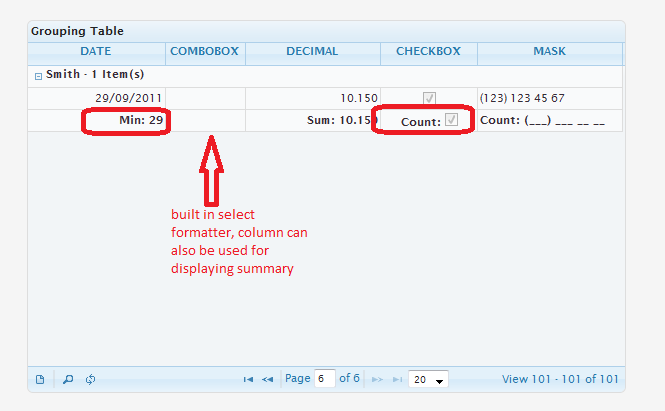
在 JQGrid 中,除了列格式化程序之外,是否可以在分组摘要单元格上使用不同的格式化程序?
是否可以对数据行和摘要行使用不同的格式化程序?例如,我想将摘要信息(summaryType = count)添加到复选框格式的列,摘要值显示为选中的复选框。有什么想法吗?
种类, 阿尔珀
您可以从此处查看屏幕截图:

is it possible to use different formatter for the data rows and the summary row? forexample, I want to add a summary info (summaryType= count) to a checkbox formatted column, summary value is shown as a checked checkbox. any ideas?
kinds, Alper
you can see screenshot from here:

如果你对这篇内容有疑问,欢迎到本站社区发帖提问 参与讨论,获取更多帮助,或者扫码二维码加入 Web 技术交流群。

绑定邮箱获取回复消息
由于您还没有绑定你的真实邮箱,如果其他用户或者作者回复了您的评论,将不能在第一时间通知您!

发布评论
评论(2)
我发现你的问题很有趣,因为我没有立即知道答案。现在我抽出时间重新阅读 jqGrid 分组模块的源代码并创建一个您需要的示例。
首先,我准备了演示,它显示以下结果:
如何查看摘要行包含许多以不同方式格式化的元素:
要在每个分组块的末尾有摘要行,我们需要定义
groupSummary: [true]< jqGrid 的groupingView参数中的 /code> 属性。然后我们需要为所有列定义 summaryType 属性摘要行没有空单元格的colModel。例如,在最简单的情况下,我为列
'amount'定义了属性summaryType: 'sum'。对于
'tax'列,我另外定义了summaryTpl:因此,
'tax'列的摘要包含斜体文本。对于
'total'列,我根据显示的值使用了不同的颜色。值大于 1000 的结果显示为绿色。其他值以红色显示。该实现是摘要行的真正自定义格式化程序:我使用自定义格式化程序,而不是
formatter: 'number'。我不想再次实现formatter: 'number',因此我根据$.fn.fmatter('number', cellval 调用了预定义的 'number' 格式化程序、opts、rwdat、act)。上面代码中最重要的部分是
在格式化网格单元期间,将使用初始化为行 ID 的
opts.rowId来调用自定义格式化程序。仅在格式化摘要行时,opts.rowId将为空字符串 ("")。我利用这一事实来实现自定义格式。在
'close'栏中我展示了另一个技巧。我使用定义为函数的summaryType。人们可以使用它来进行一些自定义汇总计算,另一种作为标准类型:“sum”、“min”、“max”、“count”和“avg”。在演示中,我显示所有复选框的“计数”和选定复选框的“计数”,并在摘要中显示结果。此外,摘要单元格还具有附加复选框,如果组中至少有一个复选框被选中,则该复选框也会被选中。包含自定义格式化程序的相应代码如下:我们需要保存计算的树不同值:
totalCount、checkedCount和max。上面的代码显示,我们可以将初始字符串val参数更改为保存我们需要的所有信息的对象。在格式化摘要行期间,将调用自定义格式化程序,并将cellval初始化为我们之前创建的val对象。这样我们就可以保存任何自定义信息然后显示它。我希望就演示而言,您将能够创建您需要的任何汇总分组行。
I found your question very interesting, because I didn't known the answer immediately. Now I found time to reread the source code of the grouping module of jqGrid and create an example which you need.
First of all I prepared the demo which display the following results:
How you can see the summary row has many elements which are formatted in the different way:
To have summary line at the end of every grouping block we need to define
groupSummary: [true]property in thegroupingViewparameter of jqGrid. Then we need to define summaryType property for all columns in thecolModelwhere the summary row have not empty cell.For example, in the simplest case I defined for the column
'amount'the propertysummaryType: 'sum'.For the column
'tax'I definedsummaryTpladditionally:As the result the summary for the
'tax'column contains italic text.For the
'total'column I used different colors depend on the displayed value. The results having the value grater as 1000 are displayed in green. Other values are displayed in red color. The implementation is real custom formatter for the summary row:Instead of
formatter: 'number'I used custom formatter. I didn't want to implement theformatter: 'number'one more time, so I called the predefined 'number' formatter with respect of$.fn.fmatter('number', cellval, opts, rwdat, act).The most important part of the above code is the line
During formatting the grid cells the custom formatter will be called with the
opts.rowIdinitialized as the row id. Only in case of formatting the summary row theopts.rowIdwill be the empty string (""). I use the fact to implement custom formatting.In the column
'closed'I show one more trick. I use thesummaryTypedefined as a function. One can use this to make some custom summary calculation another as the standard types: "sum", "min", "max", "count" and "avg". In the demo I display "count" of all and "count" of selected checkboxes and display the results in the summary. Moreover the summary cell has additionally checkbox which is checked if at least one checkbox in the group is checked. The corresponding code inclusive the custom formatter is the following:We needs to hold tree different values which we calculate:
totalCount,checkedCountandmax. The code above shows that one can change the initial stringvalparameter to the object which hold all information which we need. During formatting the summary row the custom formatter will be called with thecellvalinitialized to thevalobject which we created before. In the way we can save any custom information and then display it.I hope with respect of the demo you will be able create any summary grouping row which you need.
您使用自定义格式化程序吗?您可以做的是创建一个自定义格式化程序来根据输入显示不同的内容。我不确定您的输入是否返回 true 或 false,但这应该有效:
如果您有疑问或者这与您的想法是否不同,请告诉我
are you using a custom formatter? what you can do is make a custom formatter to display different things based on the input. I'm not sure if you are returning true or false as your input but something liek this should work:
let me know if you have questions or if this is different then what you are thinking