在ggplot2中设置base_size时重叠轴标签
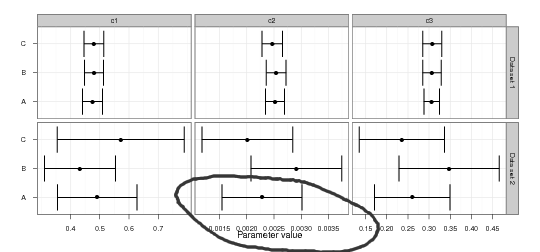
我正在通过 theme_set 更改 base_size。当我在屏幕上查看结果图时,它看起来很棒。但是,当我将其另存为 pdf 时,x 轴标签有点太接近轴编号。
一件小事:
theme_set(theme_bw(base_size = 9))
不会造成任何问题,但却
theme_grey(theme_bw(base_size = 9))
会造成问题。下面是一个示例图:

R 代码
require(ggplot2)
theme_set(theme_bw(base_size = 9))

#Data
m = c(0.475, 0.491, 0.4800, 0.4318, 0.4797, 0.5718)
m = c(m, 0.00252, 0.00228, 0.00254, 0.00291, 0.00247, 0.00201)
m = c(m, 0.306, 0.260, 0.3067, 0.3471, 0.3073, 0.2357)

s = c(0.0172, 0.0681, 0.0163, 0.0608, 0.0170, 0.1088)
s = c(s, 0.000087, 0.000367, 0.000091, 0.000417, 0.000094, 0.000417)
s = c(s, 0.0092, 0.0447, 0.0110, 0.0593, 0.0113, 0.0504)

df = data.frame(m=m, s=s)

df$data_set = as.factor(c("Data set 1", "Data set 2"))
df$est = factor(rep(c("A",  "B", "C"), each=2))
df$par = rep(c("c1", "c2", "c3"), each=6)

g = ggplot(data =df, aes(y=est, x=m)) +
  geom_point() +
  geom_errorbarh(aes(xmax = m + 2*s, xmin = m-2*s), width=0.1) +
  facet_grid(data_set~par, scales="free_x") +
  xlab("Parameter value") + ylab("")
g

pdf("figure3.pdf", width=7.5, height=3.5)
print(g)
dev.off()
I'm changing base_size via theme_set. When I view the resulting plot on screen, it looks great. However, when I save it as a pdf, the x-axis label is a bit too close to the axis numbers.
One small thing:
theme_set(theme_bw(base_size = 9))
doesn't cause any problems but
theme_grey(theme_bw(base_size = 9))
does. Here is an example graph:

R Code
require(ggplot2)
theme_set(theme_bw(base_size = 9))

#Data
m = c(0.475, 0.491, 0.4800, 0.4318, 0.4797, 0.5718)
m = c(m, 0.00252, 0.00228, 0.00254, 0.00291, 0.00247, 0.00201)
m = c(m, 0.306, 0.260, 0.3067, 0.3471, 0.3073, 0.2357)

s = c(0.0172, 0.0681, 0.0163, 0.0608, 0.0170, 0.1088)
s = c(s, 0.000087, 0.000367, 0.000091, 0.000417, 0.000094, 0.000417)
s = c(s, 0.0092, 0.0447, 0.0110, 0.0593, 0.0113, 0.0504)

df = data.frame(m=m, s=s)

df$data_set = as.factor(c("Data set 1", "Data set 2"))
df$est = factor(rep(c("A",  "B", "C"), each=2))
df$par = rep(c("c1", "c2", "c3"), each=6)

g = ggplot(data =df, aes(y=est, x=m)) +
  geom_point() +
  geom_errorbarh(aes(xmax = m + 2*s, xmin = m-2*s), width=0.1) +
  facet_grid(data_set~par, scales="free_x") +
  xlab("Parameter value") + ylab("")
g

pdf("figure3.pdf", width=7.5, height=3.5)
print(g)
dev.off()
如果你对这篇内容有疑问,欢迎到本站社区发帖提问 参与讨论,获取更多帮助,或者扫码二维码加入 Web 技术交流群。

绑定邮箱获取回复消息
由于您还没有绑定你的真实邮箱,如果其他用户或者作者回复了您的评论,将不能在第一时间通知您!

发布评论
评论(2)
默认情况下,ggplot2 使轴标题非常接近轴文本。 中插入换行符
\n一个技巧是在字符串
By default ggplot2 make axis titles so close to axis text. A trick is to insert a newline character
\nin the string我认为这可能是
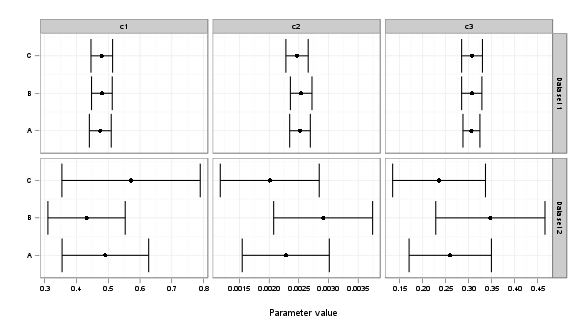
pdf的问题。将 ggsave 与 vjust = -0.5 结合使用对我有用。我会将代码的最后三行替换为“这是输出”。
I think it could be an issue with
pdf. Usingggsavewithvjust = -0.5worked for me. I would replace the last three lines of your code withHere is the output.