保存比屏幕上显示的更大的 UIElement 图像
我有一个要向用户显示的图表,我希望能够将图表作为图像导出到磁盘,以便他们可以在应用程序之外使用它(用于演示或其他内容)。
我已经成功地使用 PngBitmapEncoder 和 RenderTargetBitmap 获得了基本的想法,但是我从中得到的图像太小,无法真正使用,而我想要获得更大的图像。
我尝试简单地增加我想要渲染的控件的高度和宽度,但父级似乎可以直接控制渲染大小。由此,我尝试在内存中复制 UIElement,但渲染大小为 (0,0),当我尝试使用方法来渲染它时,例如 Measure()、Arrange() 和 UpdateLayout(),它们会抛出异常需要解耦父级来调用它们,但由于它在内存中并且未渲染,所以不应该有父级?
这一切都是通过 Visiblox 图表 API 完成的
这是我目前所拥有的,除了它不起作用:(
var width = 1600;
var height = 1200;

var newChart = new Chart { Width = width, Height = height, Title = chart.Title, XAxis = chart.XAxis, YAxis = chart.YAxis, Series = chart.Series};
Debug.WriteLine(newChart.RenderSize);
var size = new Size(width, height);
newChart.Measure(size);
newChart.Arrange(new Rect(size));
newChart.UpdateLayout();
Debug.WriteLine(newChart.RenderSize);

var rtb = new RenderTargetBitmap(width, height, 96, 96, PixelFormats.Pbgra32);
            rtb.Render(newChart);

var encoder = new PngBitmapEncoder();
encoder.Frames.Add(BitmapFrame.Create(rtb));

using (var stream = fileDialog.OpenFile())
   encoder.Save(stream);
我已经更接近了,它现在渲染图形背景轴等,但不是实际的线条下面是更新的源代码,
public static void RenderChartToImage(Chart elementToRender, string filename)
{
    if (elementToRender == null)
        return;
    Debug.Write(elementToRender.RenderSize);
    var clone = new Chart();

    clone.Width = clone.Height = double.NaN;
    clone.HorizontalAlignment = HorizontalAlignment.Stretch;
    clone.VerticalAlignment = VerticalAlignment.Stretch;
    clone.Margin = new Thickness();

    clone.Title = elementToRender.Title;
    clone.XAxis = new DateTimeAxis();
    clone.YAxis = new LinearAxis() { Range = Range<double>)elementToRender.YAxis.Range};

    foreach (var series in elementToRender.Series)
    {
        var lineSeries = new LineSeries
                             {
                                 LineStroke = (series as LineSeries).LineStroke,
                                 DataSeries = series.DataSeries
                             };
        clone.Series.Add(lineSeries);
    }


    var size = new Size(1600, 1200);

    clone.Measure(size);
    clone.Arrange(new Rect(size));
    clone.UpdateLayout();

    Debug.Write(clone.RenderSize);

    var height = (int)clone.ActualHeight;
    var width = (int)clone.ActualWidth;

    var renderer = new RenderTargetBitmap(width, height, 96d, 96d, PixelFormats.Pbgra32);

    renderer.Render(clone);

    var pngEncoder = new PngBitmapEncoder();
    pngEncoder.Frames.Add(BitmapFrame.Create(renderer));

    using (var file = File.Create(filename))
    {
        pngEncoder.Save(file);
    }
}
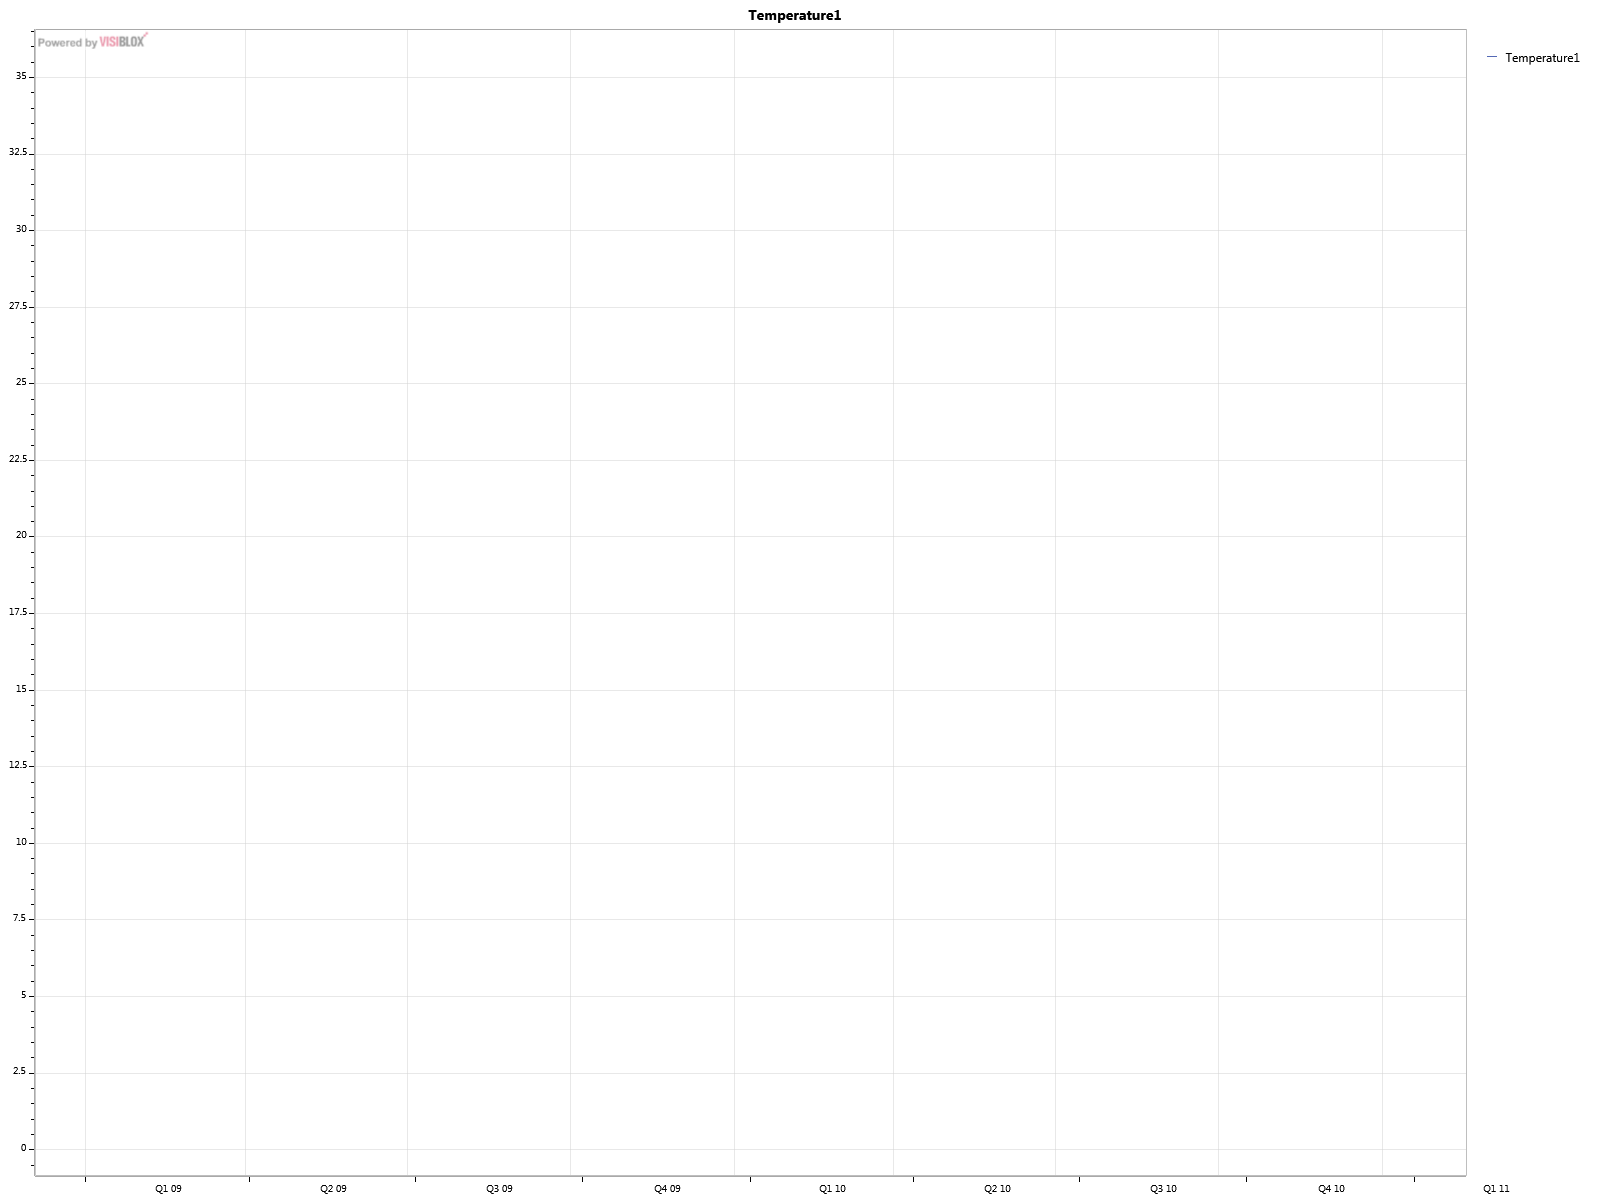
所以我得到了这样的结果: 
虽然很大,但没什么用,因为它没有任何图表。
I have a chart that I'm displaying to the user and I want to be able to export the chart as an image to disk so they can use it outside of the application (for a presentation or something).
I've managed to get the basic idea working using PngBitmapEncoder and RenderTargetBitmap but the image I get out of it is way to small to really be usable and I want to get a much larger image.
I tried to simply increase the Height and Width of the control I was wanting to render, but the parent seems to have direct control on the render size. From this I tried to duplicate the UIElement in memory but then the render size was (0,0) and when I tried to use methods to get it to render, such as Measure() Arrange() and UpdateLayout() they throw exceptions about needing to decouple the parent to call these, but as it's in memory and not rendered there shouldn't be a parent?
This is all done with Visiblox charting API
Here is what I've got currently, except it doesn't work :(
var width = 1600;
var height = 1200;

var newChart = new Chart { Width = width, Height = height, Title = chart.Title, XAxis = chart.XAxis, YAxis = chart.YAxis, Series = chart.Series};
Debug.WriteLine(newChart.RenderSize);
var size = new Size(width, height);
newChart.Measure(size);
newChart.Arrange(new Rect(size));
newChart.UpdateLayout();
Debug.WriteLine(newChart.RenderSize);

var rtb = new RenderTargetBitmap(width, height, 96, 96, PixelFormats.Pbgra32);
            rtb.Render(newChart);

var encoder = new PngBitmapEncoder();
encoder.Frames.Add(BitmapFrame.Create(rtb));

using (var stream = fileDialog.OpenFile())
   encoder.Save(stream);
I've gotten a bit closer, it now render the graph background the axis' etc. but just not the actual lines that are being graphed. Below is an updated source
public static void RenderChartToImage(Chart elementToRender, string filename)
{
    if (elementToRender == null)
        return;
    Debug.Write(elementToRender.RenderSize);
    var clone = new Chart();

    clone.Width = clone.Height = double.NaN;
    clone.HorizontalAlignment = HorizontalAlignment.Stretch;
    clone.VerticalAlignment = VerticalAlignment.Stretch;
    clone.Margin = new Thickness();

    clone.Title = elementToRender.Title;
    clone.XAxis = new DateTimeAxis();
    clone.YAxis = new LinearAxis() { Range = Range<double>)elementToRender.YAxis.Range};

    foreach (var series in elementToRender.Series)
    {
        var lineSeries = new LineSeries
                             {
                                 LineStroke = (series as LineSeries).LineStroke,
                                 DataSeries = series.DataSeries
                             };
        clone.Series.Add(lineSeries);
    }


    var size = new Size(1600, 1200);

    clone.Measure(size);
    clone.Arrange(new Rect(size));
    clone.UpdateLayout();

    Debug.Write(clone.RenderSize);

    var height = (int)clone.ActualHeight;
    var width = (int)clone.ActualWidth;

    var renderer = new RenderTargetBitmap(width, height, 96d, 96d, PixelFormats.Pbgra32);

    renderer.Render(clone);

    var pngEncoder = new PngBitmapEncoder();
    pngEncoder.Frames.Add(BitmapFrame.Create(renderer));

    using (var file = File.Create(filename))
    {
        pngEncoder.Save(file);
    }
}
So I get out something like this:
Which while big, isn't useful as it has nothing charted.
如果你对这篇内容有疑问,欢迎到本站社区发帖提问 参与讨论,获取更多帮助,或者扫码二维码加入 Web 技术交流群。

绑定邮箱获取回复消息
由于您还没有绑定你的真实邮箱,如果其他用户或者作者回复了您的评论,将不能在第一时间通知您!

发布评论
评论(3)
http://www.visiblox.com/blog/2011/05/printing -visiblox-charts
我缺少的要点是
在内存中渲染图表之前设置它,然后在完成后恢复它。从那里开始一切都很顺利:D
http://www.visiblox.com/blog/2011/05/printing-visiblox-charts
The main point I was missing was
Setting this before I rendered the chart in memory and then reverting it once I had finished. From there it was smooth sailing :D
我认为这些可能会有所帮助:
导出 Visifire Silverlight 图表作为图像,带有可下载的 silverlight 解决方案。
在 WPF 中将图表导出为图像
I think these might help :
Exporting Visifire Silverlight Chart as Image with a downloadable silverlight solution.
Exporting Chart as Image in WPF