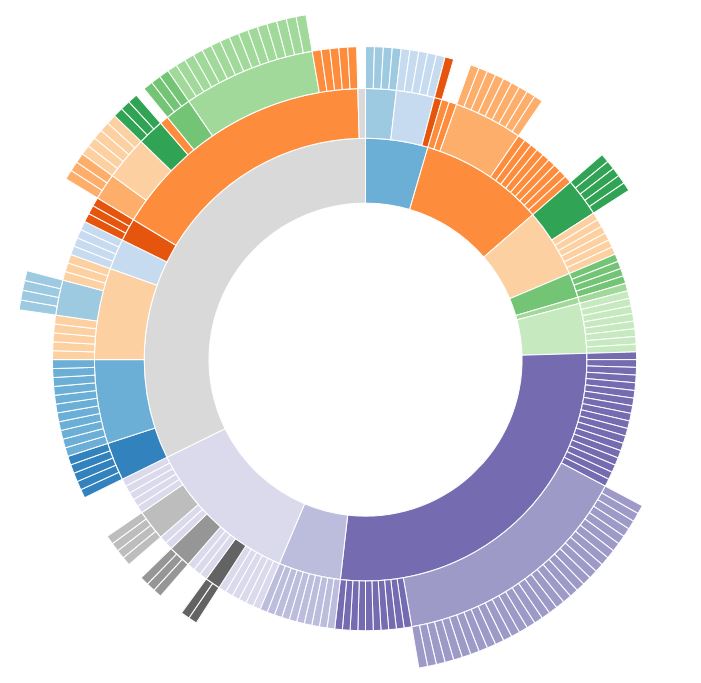
D3.js——加载和操作外部数据
我是 D3.js 的新手,正在尝试各种教程/练习/等,但我对 D3 的基本需求是加载外部数据(通常是 JSON)并根据该数据绘制一些交互式图表。
基本的旭日示例位于此处:

我成功地将其改编为我自己的数据。然而,我希望简化数据的传递并处理 D3.js 中的一些操作。例如,我想提供一个可以由 D3 根据需要进行操作的平面数据文件,而不是准备用于旭日图的分层数组。
但是,我不确定如何在 D3 的数据函数之一之外绘制旭日图。我尝试了下面的代码,而不是通过 json 加载数据,而是将其内联包含在内,以便结构可见(不出所料,它不起作用):
var w = 960,
    h = 700,
    r = Math.min(w, h) / 2,
    color = d3.scale.category20c();

var vis = d3.select("#chart").append("svg:svg")
    .attr("width", w)
    .attr("height", h)
       .append("svg:g")
    .attr("transform", "translate(" + w / 2 + "," + h / 2 + ")");

var partition = d3.layout.partition()
    .sort(null)
    .size([2 * Math.PI, r * r])
    .value(function(d) { return 1; });
var arc = d3.svg.arc()
    .startAngle(function(d) { return d.x; })
    .endAngle(function(d) { return d.x + d.dx; })
    .innerRadius(function(d) { return Math.sqrt(d.y); })
    .outerRadius(function(d) { return Math.sqrt(d.y + d.dy); });
var data = [
                        {'level1': 'Right Triangles and an Introduction to Trigonometry',
'level2': '', 'level3': '', 'level4': '', 'branch': 'TRI', 'subject':
'MAT'},
                        {'level1': '', 'level2': 'The Pythagorean Theorem', 'level3': '',
'level4': '', 'branch': 'TRI', 'subject': 'MAT'},
                        {'level1': '', 'level2': '', 'level3': 'The Pythagorean Theorem',
'level4': '', 'branch': 'TRI', 'subject': 'MAT'},
                        {'level1': '', 'level2': '', 'level3': 'Pythagorean Triples',
'level4': '', 'branch': 'TRI', 'subject': 'MAT'}
                        ];
console.log(data); // looks good here
var nest = d3.nest()
        .key(function(d) { return d.subject;})
        .key(function(d) { return d.branch;})
        .entries(data);
console.log(nest); // looks good here
var path = vis.selectAll("path")
      .data(nest)
    .enter().append("svg:path")
      .attr("display", function(d) { return d.depth ? null :
"none"; }) // hide inner ring
      .attr("d", arc)
      .attr("fill-rule", "evenodd")
      .style("stroke", "#fff")
      .style("fill", function(d) { return color((d.children ? d :
d.parent).name); });
HTML 看起来像这样:
<div class="gallery" id="chart">
    <svg width="960" height="700">
        <g transform="translate(480,350)">
            <path display="none" d="MNaN,NaNANaN,NaN 0 1,1 NaN,NaNL0,0Z" fill-rule="evenodd" style="stroke: #ffffff; "/>
        </g>
    </svg>
</div>
我确信我做错了一些事情很简单,但如果我没有将绘图函数嵌套在 d3.json 这样的函数中,我就很难理解 D3 将如何遍历所有数据并绘制图表。
有什么想法吗?
I'm new to D3.js and am playing around with a variety of tutorials/exercises/etc, but my basic need for D3 is to load external data (usually JSON) and draw some interactive charts based on that data.
The basic sunburst example is here:

I successfully adapted it to my own data. However, I was hoping to simplify the delivery of data and handle some of the manipulation within D3.js. For instance, instead of a hierarchical array that is ready for sunburst diagram, I would like to deliver a flat data file that can be manipulated as needed by D3.
But, I'm not sure how to draw a sunburst chart outside of one of D3's data functions. I tried the below code, and instead of loading the data via json included it inline so the structure is visible (unsurprisingly it did not work):
var w = 960,
    h = 700,
    r = Math.min(w, h) / 2,
    color = d3.scale.category20c();

var vis = d3.select("#chart").append("svg:svg")
    .attr("width", w)
    .attr("height", h)
       .append("svg:g")
    .attr("transform", "translate(" + w / 2 + "," + h / 2 + ")");

var partition = d3.layout.partition()
    .sort(null)
    .size([2 * Math.PI, r * r])
    .value(function(d) { return 1; });
var arc = d3.svg.arc()
    .startAngle(function(d) { return d.x; })
    .endAngle(function(d) { return d.x + d.dx; })
    .innerRadius(function(d) { return Math.sqrt(d.y); })
    .outerRadius(function(d) { return Math.sqrt(d.y + d.dy); });
var data = [
                        {'level1': 'Right Triangles and an Introduction to Trigonometry',
'level2': '', 'level3': '', 'level4': '', 'branch': 'TRI', 'subject':
'MAT'},
                        {'level1': '', 'level2': 'The Pythagorean Theorem', 'level3': '',
'level4': '', 'branch': 'TRI', 'subject': 'MAT'},
                        {'level1': '', 'level2': '', 'level3': 'The Pythagorean Theorem',
'level4': '', 'branch': 'TRI', 'subject': 'MAT'},
                        {'level1': '', 'level2': '', 'level3': 'Pythagorean Triples',
'level4': '', 'branch': 'TRI', 'subject': 'MAT'}
                        ];
console.log(data); // looks good here
var nest = d3.nest()
        .key(function(d) { return d.subject;})
        .key(function(d) { return d.branch;})
        .entries(data);
console.log(nest); // looks good here
var path = vis.selectAll("path")
      .data(nest)
    .enter().append("svg:path")
      .attr("display", function(d) { return d.depth ? null :
"none"; }) // hide inner ring
      .attr("d", arc)
      .attr("fill-rule", "evenodd")
      .style("stroke", "#fff")
      .style("fill", function(d) { return color((d.children ? d :
d.parent).name); });
Here's what the HTML looks like:
<div class="gallery" id="chart">
    <svg width="960" height="700">
        <g transform="translate(480,350)">
            <path display="none" d="MNaN,NaNANaN,NaN 0 1,1 NaN,NaNL0,0Z" fill-rule="evenodd" style="stroke: #ffffff; "/>
        </g>
    </svg>
</div>
I'm sure I'm doing something wrong that is pretty simple, but I'm having trouble getting my brain around how D3 will go through all the data and map out the diagram if I'm not nesting the drawing functions within a function like d3.json.
Any thoughts?
如果你对这篇内容有疑问,欢迎到本站社区发帖提问 参与讨论,获取更多帮助,或者扫码二维码加入 Web 技术交流群。

绑定邮箱获取回复消息
由于您还没有绑定你的真实邮箱,如果其他用户或者作者回复了您的评论,将不能在第一时间通知您!

发布评论
评论(1)
您似乎忘记调用
partition.nodes(nest)来使用适当的布局位置填充数据以呈现路径。在您链接到的 sunburst 示例 中,JSON 数据的绑定如下:
这相当于:
两种方法都可以,但是您需要调用
partition.nodessomewhere 否则数据将没有位置。另请注意,具有指定嵌套的示例数据将生成具有单个节点的层次结构,因为所有指定的嵌套字段都是相同的。
It looks like you've forgotten to call
partition.nodes(nest)to populate the data with the appropriate layout positions for rendering the paths.In the sunburst example that you linked to, the JSON data is bound like this:
This is equivalent to:
Either approach would work, but you need to call
partition.nodessomewhere otherwise the data will have no positions.Also note that your example data with the specified nesting would produce a hierarchy with a single node, since all the specified nested fields are the same.