“图像”的操作和“pcolor” matlab中矩阵可视化的函数
我有一些矩阵,我希望将其可视化以了解它们包含的值。但是我默认使用的函数 image 效果很差结果。在可视化合适之前,我必须使用适当的值手动缩放矩阵。 我的矩阵按值 1 缩放: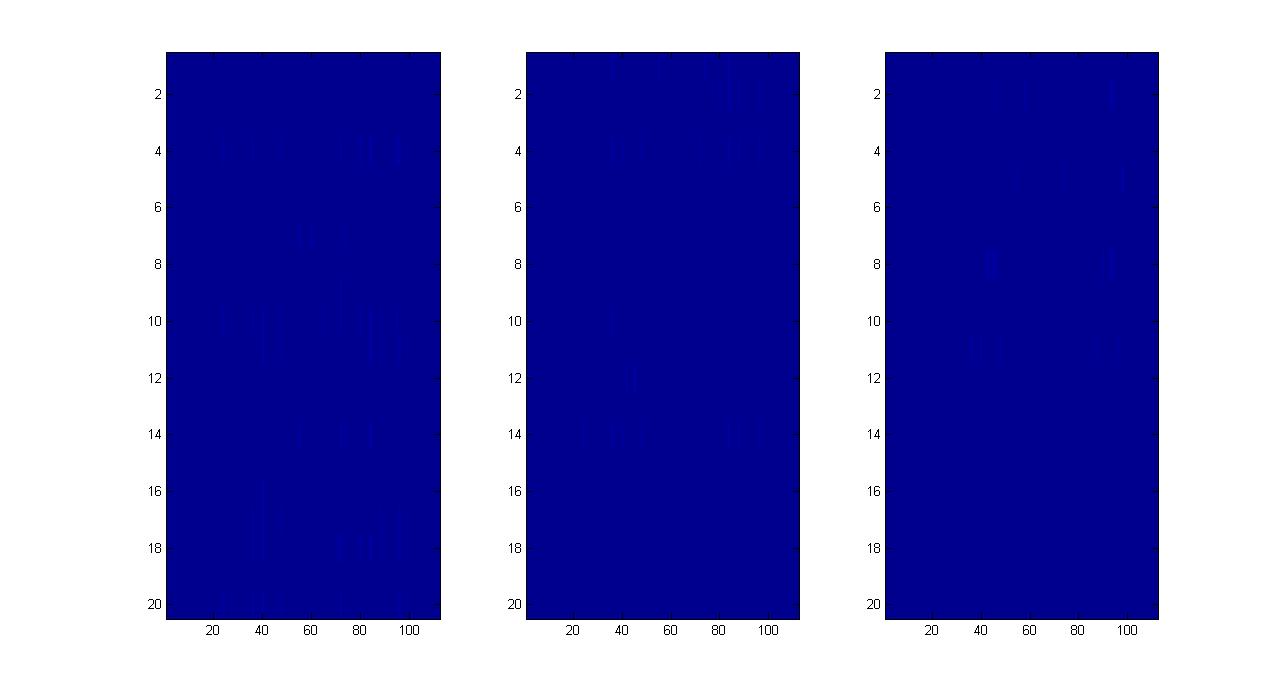
image(Breceive(1+(ii-1)*20:20+(ii-1)*20,:)*1)
我的矩阵按值 10 缩放
image(Breceive(1+(ii-1)*20:20+(ii-1)*20,:)*10)
我的矩阵按值 50 缩放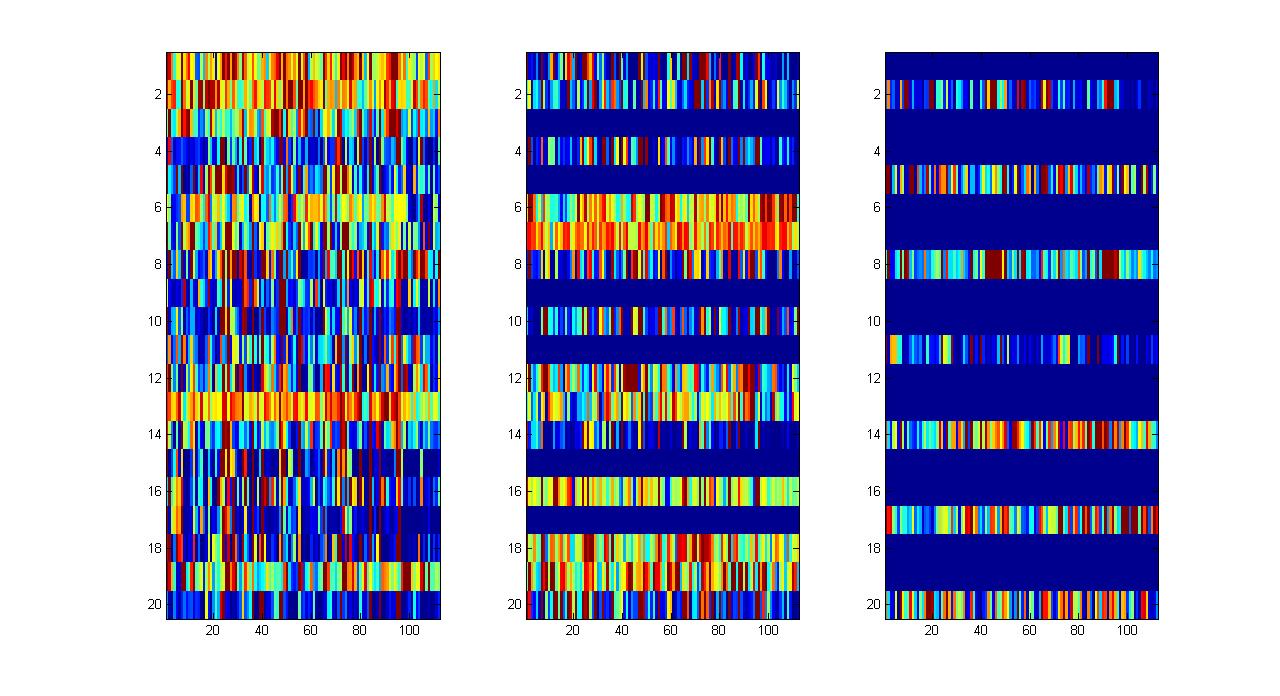
image(Breceive(1+(ii-1)*20:20+(ii-1)*20,:)*50)
我的矩阵按值缩放 10000
image(Breceive(1+(ii-1)*20:20+(ii-1)*20,:)*10000)
添加了值 10000 的矩阵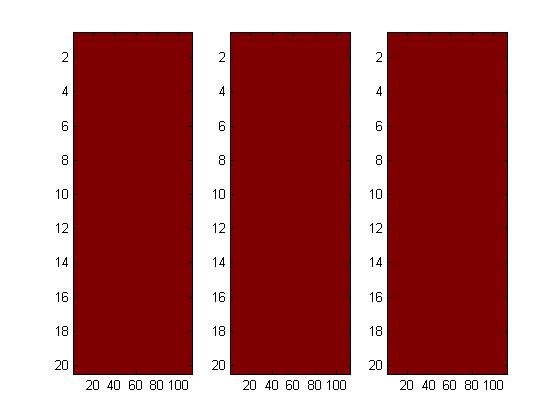
image(Breceive(1+(ii-1)*20:20+(ii-1)*20,:)+10000)
但使用函数 pcolor 无论值如何,缩放或添加都不会改变呈现的矩阵的颜色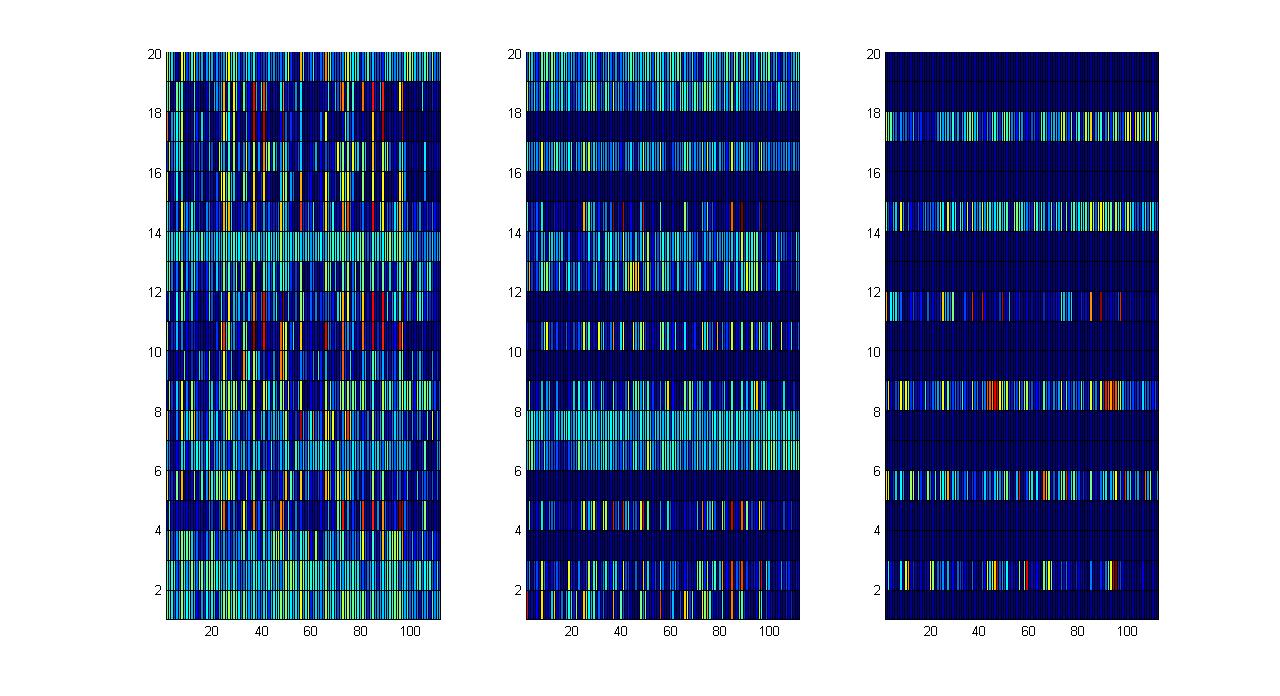 但实际上我们看到不同数量的行被着色(这里有 6 行,之前有 7 行)
pcolor(Breceive(1+(ii-1)*20:20+(ii-1)*20,:))
我认为 image 应该是尺度不变的?它预先对数据进行标准化。是否可以相信 pcolor 正在对颜色值进行适当的比例转换?是否有一些参数或方法可以使图像稳定?为什么 pcolor 没有绘制相同的信息?
I have matrices which I wish to visualize to get a feel for the values they contain. But the function image which I use by default gives a poor result. I have to scale the matrix manually with an appropriate value before the visualization is suitable.
my matrices scaled by value 1:
image(Breceive(1+(ii-1)*20:20+(ii-1)*20,:)*1)
my matrices scaled by value 10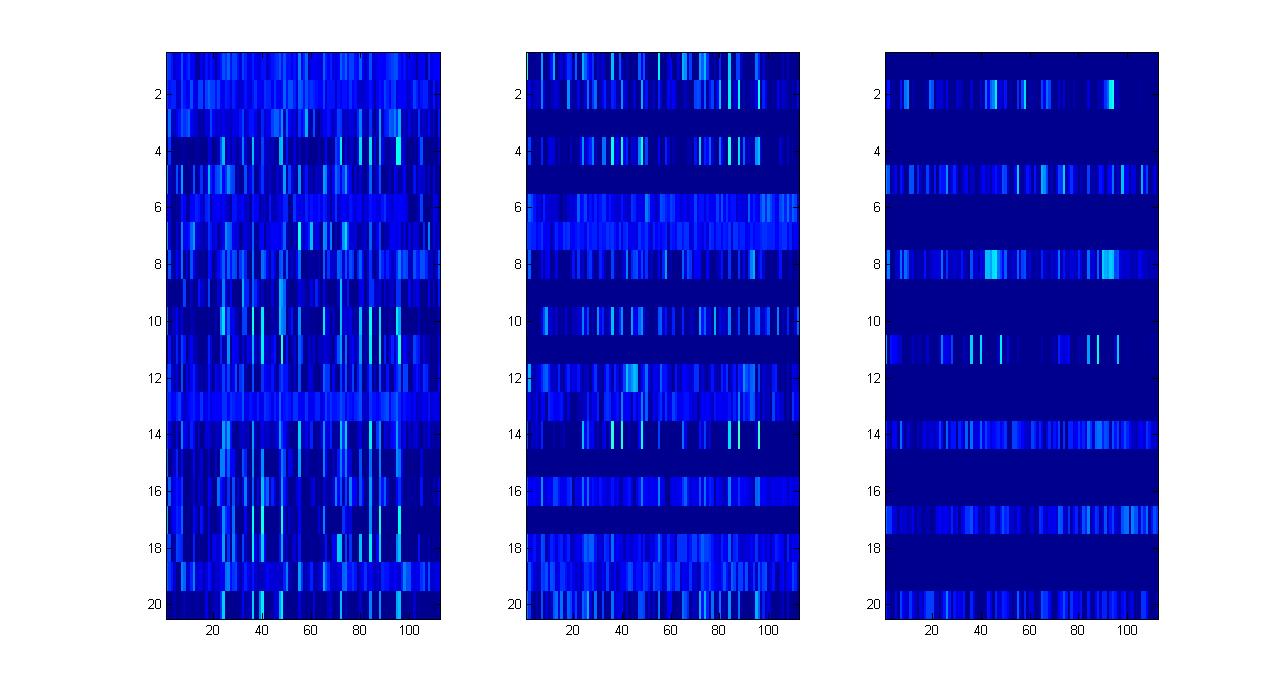
image(Breceive(1+(ii-1)*20:20+(ii-1)*20,:)*10)
my matrices scaled by value 50
image(Breceive(1+(ii-1)*20:20+(ii-1)*20,:)*50)
my matrices scaled by value 10000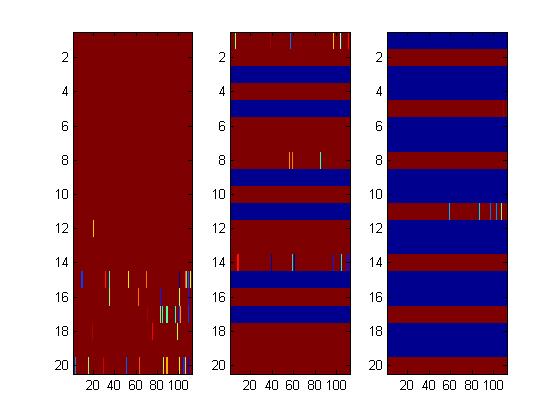
image(Breceive(1+(ii-1)*20:20+(ii-1)*20,:)*10000)
my matrices with value 10000 added
image(Breceive(1+(ii-1)*20:20+(ii-1)*20,:)+10000)
but using function pcolor the scaling or addition does not change the presented matrices' colorings regardless of the value But actually we see that a different number of rows get colored (6 here but 7 before)
pcolor(Breceive(1+(ii-1)*20:20+(ii-1)*20,:))
I thought that image should be scale invariant? That it normalizes the data beforehand. Can pcolor be trusted that it is doing a proper scale translation to color values? Is there some parameter or way to make image be stable? And why is pcolor not plotting the same information?
如果你对这篇内容有疑问,欢迎到本站社区发帖提问 参与讨论,获取更多帮助,或者扫码二维码加入 Web 技术交流群。

绑定邮箱获取回复消息
由于您还没有绑定你的真实邮箱,如果其他用户或者作者回复了您的评论,将不能在第一时间通知您!

发布评论
评论(1)
image(C) 使用 C 的元素直接索引图形的颜色图。
pcolor(C) 线性缩放 C 的元素以填充图形的颜色图然后对它们进行索引。
您可以使用 imagesc 生成缩放图像,该图像在与 pcolor 相同的方式。
image(C) uses the elements of C to directly index the figure's colormap.
pcolor(C) linearly scales the elements of C to fill the figure's colormap then indexes them.
You can use imagesc to produce a scaled image which will be invariant in the same way as pcolor.