从 x,y,z data.frame 制作线框图
我有一个 x/y/z 点的 data.frame。我知道如何使用 rgl 包制作 3d 散点图,但我想连接散点图中的每个点以制作线框或曲面图。
这段代码返回散点图
library(rgl)
Data <- expand.grid(x=seq(0,10),y=seq(0,10))
Data$z <- Data$x^2+Data$y^2
plot3d(Data)
虽然这段代码返回一个空白图:
plot3d(Data,type='wire')
我可以用格子绘制我想要的图:
library(lattice)
wireframe(z~x+y,Data)
我什至可以让它旋转:
library(TeachingDemos)
rotate.wireframe(z~x+y,Data)
但我更喜欢 rgl 而不是 lattice 因为它渲染速度更快,并且可以让您用鼠标旋转绘图。
在 rgl 中制作线框图的正确方法是什么?
I have a data.frame of x/y/z points. I know how to make a 3d scatterplot using the rgl package but I would like to connect each point in the scatterplot to make a wireframe or surface plot.
This code returns the scatter plot
library(rgl)
Data <- expand.grid(x=seq(0,10),y=seq(0,10))
Data$z <- Data$x^2+Data$y^2
plot3d(Data)
While this code returns a blank graph:
plot3d(Data,type='wire')
I can make the plot I want with lattice:
library(lattice)
wireframe(z~x+y,Data)
I can even make it rotate:
library(TeachingDemos)
rotate.wireframe(z~x+y,Data)
But I prefer rgl over lattice because it renders much quicker and lets you rotate the plot with the mouse.
Whats the proper way to make a wireframe plot in rgl?
如果你对这篇内容有疑问,欢迎到本站社区发帖提问 参与讨论,获取更多帮助,或者扫码二维码加入 Web 技术交流群。

绑定邮箱获取回复消息
由于您还没有绑定你的真实邮箱,如果其他用户或者作者回复了您的评论,将不能在第一时间通知您!

发布评论
评论(1)
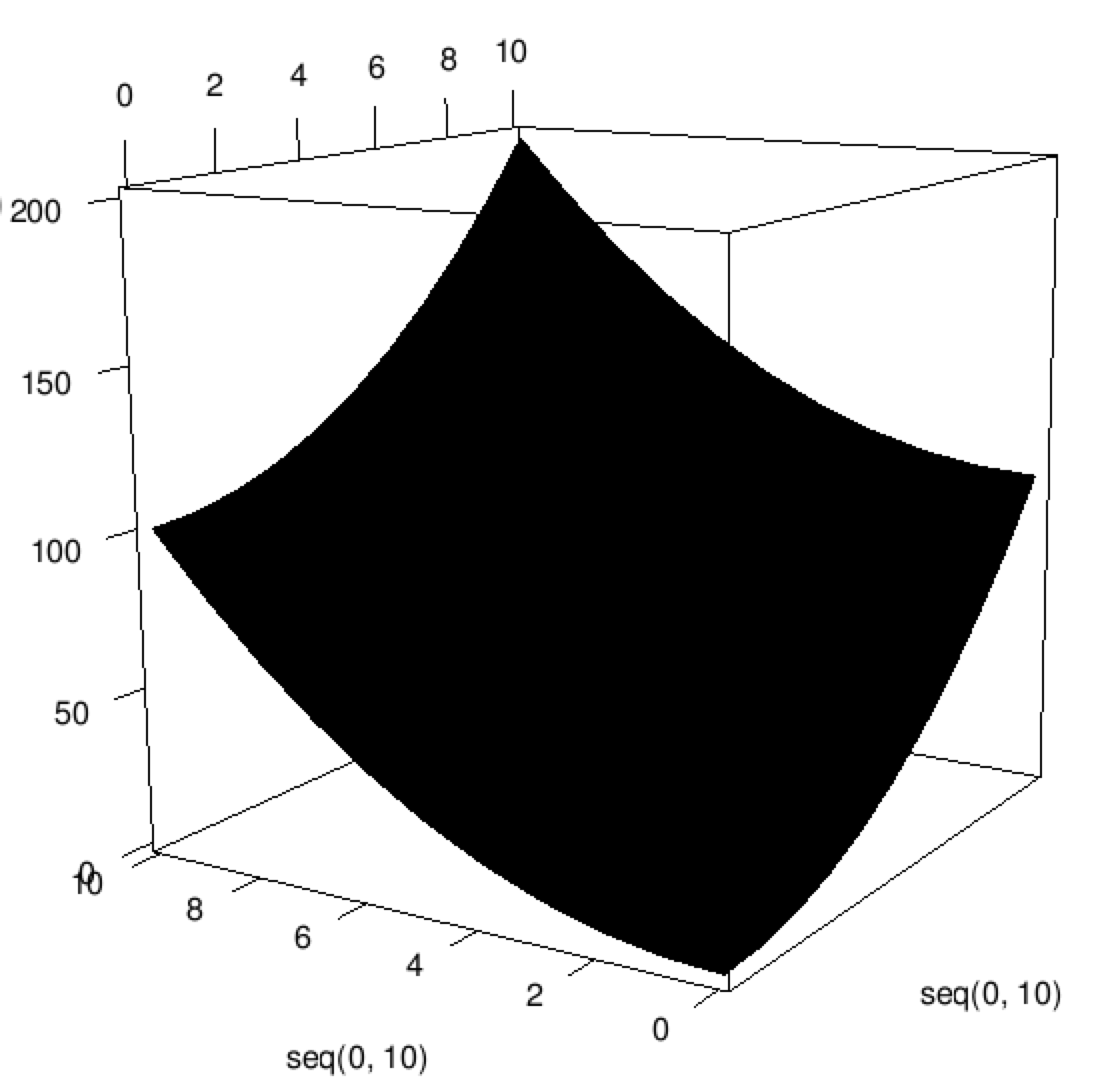
rgl 中的曲面绘图函数是 persp3d,与 base::persp 类似,它需要一个矩阵作为 z 参数的输入,
在使用我使用的屏幕抓取程序捕获它之前,我确实旋转了该图形:

The surface drawing plot function in rgl is persp3d and like base::persp, it needs a matrix as input to the z argument
I did spin this graphic a bit before capturing it with a screen grabbing program I use:
