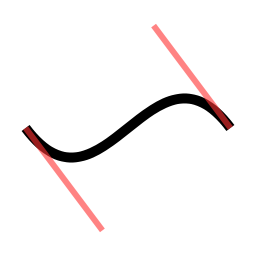
不知道4个点怎么画曲线?
根据 cairo 示例代码,以下代码
double x=25.6,  y=128.0;
double x1=102.4, y1=230.4,
       x2=153.6, y2=25.6,
       x3=230.4, y3=128.0;

cairo_move_to (cr, x, y);
cairo_curve_to (cr, x1, y1, x2, y2, x3, y3);

cairo_set_line_width (cr, 10.0);
cairo_stroke (cr);

cairo_set_source_rgba (cr, 1, 0.2, 0.2, 0.6);
cairo_set_line_width (cr, 6.0);
cairo_move_to (cr,x,y);   cairo_line_to (cr,x1,y1);
cairo_move_to (cr,x2,y2); cairo_line_to (cr,x3,y3);
cairo_stroke (cr);
可以生成曲线和两条粉色线。

但这需要 4 个点,(x,y)、(x1,y1)、(x2,y2) ), (x3,y3)
如果我只有 x,y 和 x3, y3(曲线的起点和终点), 有没有数学公式可以在不知道 x1,y1 和 x2,y2 的情况下生成那些粉红色的线?
编辑:
针对我通过以下方式生成曲线的情况。
cairo_move_to (cr, x, y);
cairo_curve_to (cr, x, y3, x3, y, x3, y3);
According to cairo example code, following code
double x=25.6,  y=128.0;
double x1=102.4, y1=230.4,
       x2=153.6, y2=25.6,
       x3=230.4, y3=128.0;

cairo_move_to (cr, x, y);
cairo_curve_to (cr, x1, y1, x2, y2, x3, y3);

cairo_set_line_width (cr, 10.0);
cairo_stroke (cr);

cairo_set_source_rgba (cr, 1, 0.2, 0.2, 0.6);
cairo_set_line_width (cr, 6.0);
cairo_move_to (cr,x,y);   cairo_line_to (cr,x1,y1);
cairo_move_to (cr,x2,y2); cairo_line_to (cr,x3,y3);
cairo_stroke (cr);
can generate the curve and two pink lines.

But that need 4 points, (x,y), (x1,y1), (x2,y2), (x3,y3)
If I only have x,y and x3, y3 (start and end points of the curve),
is there any math formula to generate those pink lines without knowing x1,y1 and x2,y2?
Edit:
Its for the case that I generate the curve through following way.
cairo_move_to (cr, x, y);
cairo_curve_to (cr, x, y3, x3, y, x3, y3);
如果你对这篇内容有疑问,欢迎到本站社区发帖提问 参与讨论,获取更多帮助,或者扫码二维码加入 Web 技术交流群。

绑定邮箱获取回复消息
由于您还没有绑定你的真实邮箱,如果其他用户或者作者回复了您的评论,将不能在第一时间通知您!

发布评论
评论(3)
只需提出要点:
中点可以计算为:
P中 = (x1+x3)/2 , (y1 >+y3)/2
Just make the points up:
The midpoint can be calculated as:
Pmid = (x1+x3)/2 , (y1+y3)/2
除非您提供某种可用于导出粉红线位置的约束。两个端点本身只能定义一条直线段。
Not unless you provide some kind of constraint that can be used to derive the location of the pink lines. By themselves, two end-points can only define a straight line segment.
粉色线代表从两个端点的出发向量。如果没有这些向量,两点之间的“曲线”只是一条直线(除非您有其他定义它的信息)。
如果没有 (x1,y1) 和 (x2,y2),则可以使用 (x3,y3) 作为 (x,y) 的粉红色线的端点,反之亦然。它们最终会位于黑线的正上方,这是它们应该位于直线的位置。
如果曲线是由函数定义的,则在接近端点时计算导数并沿该角度绘制切线。
The pink lines represent the departure vectors from the two end points. Without these vectors, the "curve" between the two points is simply a straight line (unless you have some other information that defines it).
If you don't have (x1,y1) and (x2,y2), you can just use (x3,y3) as the endpoint for the pink line from (x,y) and vice versa. They'll end up right on top of your black line, which is where they should be for a straight line.
If the curve is defined by a function, calculate the derivative as you approach the end points and draw the tangent line along that angle.