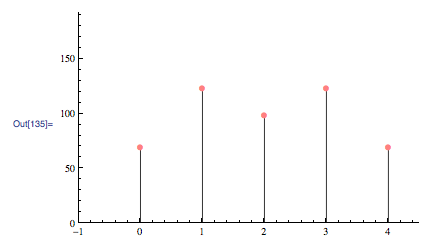
在 Mathematica 的 ListPlot 中指定点样式
考虑到
dacount = {{0, 69}, {1, 122}, {2, 98}, {3, 122}, {4, 69}}

ListPlot[dacount, AxesOrigin -> {-1, 0},
         PlotMarkers ->Automatic
         PlotStyle-> Lighter[Red, #] & /@ Range[0.5, 1, 0.1],
         Filling -> Axis, FillingStyle -> Opacity[0.8],
         PlotRange -> {{-1, 4.5}, {0, 192}}]

我希望每个点都采用不同的红色阴影。 但我无法理解如何为我尝试设置为不同列表的点设置样式。
Considering
dacount = {{0, 69}, {1, 122}, {2, 98}, {3, 122}, {4, 69}}

ListPlot[dacount, AxesOrigin -> {-1, 0},
         PlotMarkers ->Automatic
         PlotStyle-> Lighter[Red, #] & /@ Range[0.5, 1, 0.1],
         Filling -> Axis, FillingStyle -> Opacity[0.8],
         PlotRange -> {{-1, 4.5}, {0, 192}}]

My hope there was for each point to take a different shade of red.
But I can`t understand how to have a style for point which I tried to set as different list.
如果你对这篇内容有疑问,欢迎到本站社区发帖提问 参与讨论,获取更多帮助,或者扫码二维码加入 Web 技术交流群。

绑定邮箱获取回复消息
由于您还没有绑定你的真实邮箱,如果其他用户或者作者回复了您的评论,将不能在第一时间通知您!

发布评论
评论(2)
在原始代码中,PlotStyle 选项不会影响标记符号,因此您可以将其忽略。相反,将 PlotMarkers 选项更改为以下内容:
在将列表 dacount 替换为以下内容之前,这还不会达到预期的效果:
通过以这种方式增加点列表的深度,每个点都会从列在 PlotMarkers 中。所以最终的代码是:
In your original code, the PlotStyle option won't affect the marker symbols, so you can leave it out. Instead, change your PlotMarkers option to the following:
This will not yet have the desired effect until you replace the list dacount by:
By increasing the depth of the point list in this way, each point is assigned a marker style of its own from the list in PlotMarkers. So the final code is:
您还可以通过以下方式执行此操作:
这将绘制
dacount中的每个点单独并根据x值为其分配红色阴影。然后将这些图与Show结合起来。我任意选择了不同色调的缩放和偏移。你可以选择任何你想要的,只要你确保最大值是1。
You can also do it the following way:
This plots each point in
dacountindividually and assigns it a shade of red depending on thexvalue. The plots are then combined withShow.I've arbitrarily chosen a scaling and offset for the different shades. You can choose whatever you want, as long as you ensure that the max value is 1.