JQPlot - 在 pointLabels 标签中显示真实输入值而不是点位置
如何设置 pointLabels 显示输入值而不是点位置?
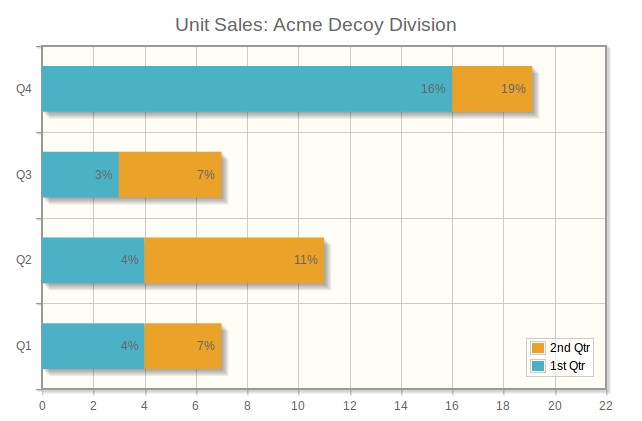
现在标签是这样的: 
意味着标签是:
16% 19%
3% 7%
4% 11%
4% 7%
但我想这样显示:
16% 3%
3% 4%
4% 7%
4% 3%
表示每个条形显示其自己输入的百分比值
How can I set pointLabels to show input value instead of point location ?
Now labels are like this :
mean labels are :
16% 19%
3% 7%
4% 11%
4% 7%
but I want to show like this :
16% 3%
3% 4%
4% 7%
4% 3%
mean each bar to show its own inputed percent value
如果你对这篇内容有疑问,欢迎到本站社区发帖提问 参与讨论,获取更多帮助,或者扫码二维码加入 Web 技术交流群。

绑定邮箱获取回复消息
由于您还没有绑定你的真实邮箱,如果其他用户或者作者回复了您的评论,将不能在第一时间通知您!

发布评论
评论(1)
我对类似问题有一些答案(或与您的问题相关的示例)。它们可能在下面找到:
基本上,我使用的方法,由于绘图选项不起作用,自己将点标签设置为适当的值。
这是一个已知问题,在此处报告 ,似乎有一些 hack,但当时我尝试了第一个推荐的补丁,但它对我没有帮助。昨天有人发布了另一个选项,也许这个确实有效,尽管我没有测试它,因为我选择坚持我的解决方案,至少目前是这样,直到它在正式版本中修复为止。
I have a few answers to a similar problems (or with samples related to your problem). They might be found below:
Basically, the approach I used, since the plot options were not working, was to set the point labels myself to appropriate values.
This is a known issue, reported here, there seem to be some hacks but back then I tried the first recommended patch and it didn't help me. Yesterday someone posted another option maybe this one does work, though I didn't test it since I chose to stick to my solution, at least currently until it is fixed in the official release.