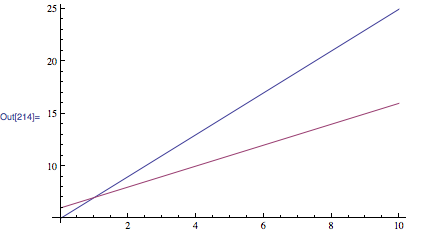
如何在 Mathematica 中标记不同的曲线?
如何分别标记每一行:
Plot[{{5 + 2 x}, {6 + x}}, {x, 0, 10}]

How can I label each of these lines separately :
Plot[{{5 + 2 x}, {6 + x}}, {x, 0, 10}]

如果你对这篇内容有疑问,欢迎到本站社区发帖提问 参与讨论,获取更多帮助,或者扫码二维码加入 Web 技术交流群。

绑定邮箱获取回复消息
由于您还没有绑定你的真实邮箱,如果其他用户或者作者回复了您的评论,将不能在第一时间通知您!

发布评论
评论(3)
有一些不错的代码可以让您在答案中动态执行此操作 到 如何注释多个数据集在 ListPlots 中。
技术说明中还定义了一个
LabelPlot命令 在绘图中标记曲线当然,如果你没有太多的图像要制作,
那么使用
Epilog< 手动添加标签并不难/a>,例如事实上,您可以使用
Locators执行类似的操作,从而允许你将标签移动到您想要的任何位置:在上面,我使定位器采用标签的形式,尽管也可以保留像上面那样的
Epilog并具有控制位置的不可见定位器。定位器也可以被约束(使用
Dynamic的第二个参数)到适当的曲线......但这并不是真正必要的。作为上述代码的示例,其中带有手动移动标签的函数:
There's some nice code that allows you to do this dynamically in an answer to How to annotate multiple datasets in ListPlots.
There's also a
LabelPlotcommand defined in the Technical Note Labeling Curves in PlotsOf course, if you don't have too many images to make,
then it's not hard to manually add the labels in using
Epilog, for exampleIn fact, you can do something similar with
Locatorsthat allows you to move the labels wherever you want:In the above I made the locators take the form of the labels, although it is also possible to keep an
Epiloglike that above and have invisible locators that control the positions.The locators could also be constrained (using the 2nd argument of
Dynamic) to the appropriate curves... but that's not really necessary.As an example of the above code with the functions with the labels moved by hand:
Mathematica 9 现在提供了包含图例的简单方法。
Mathematica 9 now provides easy ways to include legends.
您可以通过加载
PlotLegends包在图中插入图例但是,让我还注意到我不喜欢这个软件包,主要是因为它非常违反直觉,充满了太多选项,并且不像大多数 Mathematica 功能那样提供开箱即用的干净体验。您将需要摆弄一些选项来获得您想要的东西。然而,在您确实需要图例的绘图和图表中,这会很方便。另请参阅此答案和这个问题。
You can insert legends in your plot by loading the
PlotLegendspackageHowever, let me also note my dislike of this package, primarily because it's extremely counterintuitive, laden with too many options and does not provide a clean experience right out of the box like most of Mathematica's functions. You will have some fiddling around to do with the options to get what you want. However, in plots and charts where you do want a legend, this can be handy. Also see the comments to this answer and this question.