Matplotlib 子图中循环内的图例:我的代码有什么问题?
我有一个包含 6 个不同子图的图。我迭代一个循环来制作每个子图,并且此时我也想为每个子图添加图例。这是一个简单的例子:
matrixSol = scipy.random.random((6,6,4))
print matrixSol
mylegend = ['10 Million','15 Million','1 Million','20 Million','25 Million','5 Million']

for k in range(6):
    print k
    xs = matrixSol[k,:,0]
    ys = matrixSol[k,:,1]
    zs = matrixSol[k,:,3]
    plt.subplot(2,3,k+1)
    plt.plot(ys, zs,'o', c=color[k], markersize=10)#marker = styles[k])
    #print mylegend[k]
    plt.legend((mylegend[k]),loc=2)
    plt.xlabel('X')
    plt.ylabel('Y (%)')
plt.show()
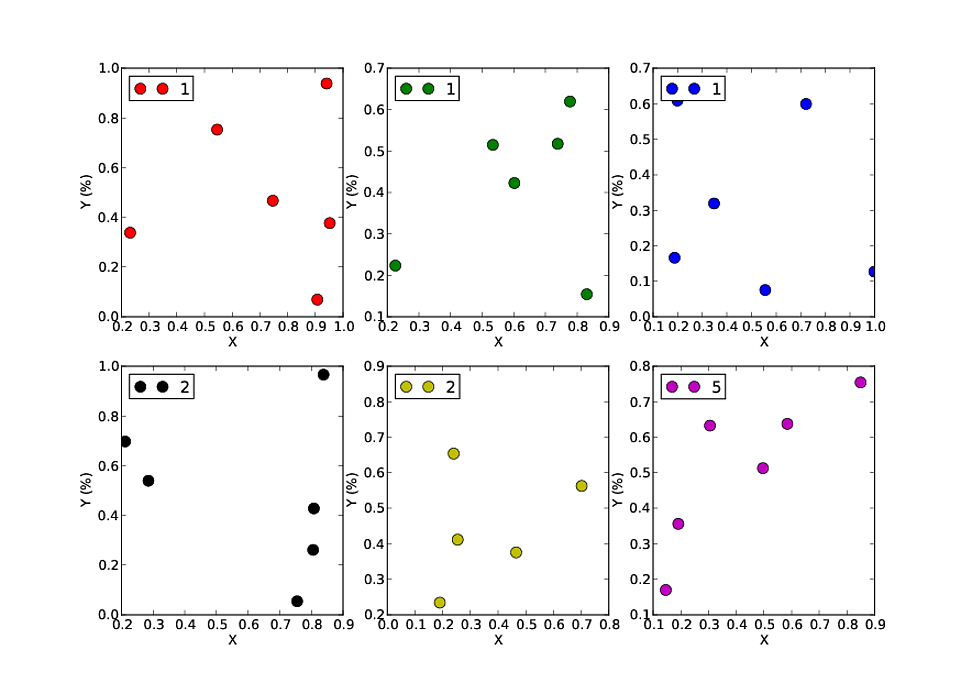
问题是我得到的图例仅选择列表中每个成员的第一个符号,请参见附图。 我的代码有什么问题??? 就是这么简单的事情!非常感谢!任何帮助将不胜感激!
I have a plot with 6 different subplots. I iterate through a loop to make each of the subplots and I want to add the legend for each subplot at this time too. So here is an easy example:
matrixSol = scipy.random.random((6,6,4))
print matrixSol
mylegend = ['10 Million','15 Million','1 Million','20 Million','25 Million','5 Million']

for k in range(6):
    print k
    xs = matrixSol[k,:,0]
    ys = matrixSol[k,:,1]
    zs = matrixSol[k,:,3]
    plt.subplot(2,3,k+1)
    plt.plot(ys, zs,'o', c=color[k], markersize=10)#marker = styles[k])
    #print mylegend[k]
    plt.legend((mylegend[k]),loc=2)
    plt.xlabel('X')
    plt.ylabel('Y (%)')
plt.show()
The problem is that I am getting a legend that picks only the first symbol of each member of the list, please see figure attached.
What is wrong with my code????
it is such a simple thing! thank you very much! any help will be appreciated!
如果你对这篇内容有疑问,欢迎到本站社区发帖提问 参与讨论,获取更多帮助,或者扫码二维码加入 Web 技术交流群。

绑定邮箱获取回复消息
由于您还没有绑定你的真实邮箱,如果其他用户或者作者回复了您的评论,将不能在第一时间通知您!

发布评论
评论(2)
使用:
或者,Chris Redford 已经指出的解决方案也有效:
Use:
alternatively, the solution already indicated by Chris Redford also works:
我很确定它正在处理以下行中的代码
(mylegend[k]):就好像字符串(例如
'10 Million')本身就是一个列表(例如['1', '0', ' ', 'M', 'i', 'l', 'l', 'i', 'o', 'n'])。如果您将该行更改为使用
(mylegend[k],)(逗号指定它是一个元组),它可能会正常工作:I'm pretty sure it's treating the code
(mylegend[k])in the line:As if the string (e.g.
'10 Million') is itself a list (e.g.['1', '0', ' ', 'M', 'i', 'l', 'l', 'i', 'o', 'n']).If you change that line to use
(mylegend[k],)(comma to specify it is a tuple), it might work right: