得到一个躲避的条形图?
我刚刚遇到了这段代码,它可以让我绘制多个坐标(我知道这在社区中是一个坏主意,但我需要这样做来比较不同的指标)。由于这不能在 ggplot2 中固有地完成,我想知道是否可以调整以下代码来完成我需要的操作:
twoord.plot(2:10,seq(3,7,by=0.5)+rnorm(9),
  1:15,rev(60:74)+rnorm(15),xlab="Sequence",
  ylab="Ascending values",rylab="Descending values",
  main="Plot with two ordinates - bars on the left",
  type=c("bar","l"),lcol=3,rcol=4)
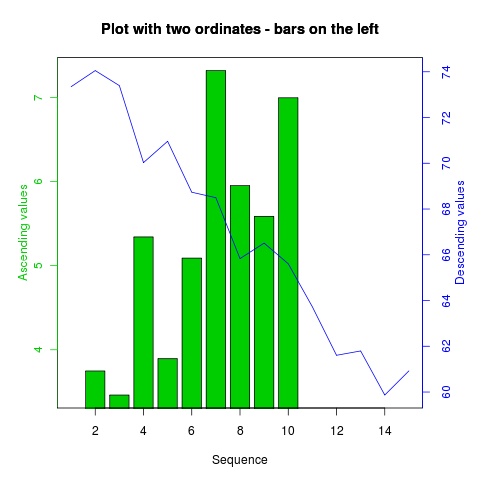
绘制以下内容:

我正在寻找的是并排绘制多个条形图。我尝试用 type=c("bar", "bar") 替换 type=c("bar", "l") ,但这给了我重叠的条形。我想要绘制的确切数据如下:
Category    SubCat  Value
A           Cat1    0.1
B           Cat1    0.2
A           Cat2    0.3
B           Cat2    0.24
A           Cat3    13
B           Cat3    41
A           Cat4    60
B           Cat4    146
我希望(Cat1,Cat2)下的(A,B)的刻度位于左侧,(Cat3,Cat4)下的(A,B)的刻度位于左侧右侧以及 A 和 B 下的所有条形图分别分组在一起。有人可以告诉我该怎么做吗?
I just came across this code that lets me plot multiple ordinates (I know it is a bad notion in the community but I need to do it to compare different metrics). Since this cannot be done inherently in ggplot2, I was wondering if I can adapt the following code to do what I need:
twoord.plot(2:10,seq(3,7,by=0.5)+rnorm(9),
  1:15,rev(60:74)+rnorm(15),xlab="Sequence",
  ylab="Ascending values",rylab="Descending values",
  main="Plot with two ordinates - bars on the left",
  type=c("bar","l"),lcol=3,rcol=4)
plots the following:

What I am looking for is to plot multiple bars side to side. I tried replacing type=c("bar", "l") with type=c("bar", "bar") but that gave me overlapping bars. The exact data I want to plot is the following:
Category    SubCat  Value
A           Cat1    0.1
B           Cat1    0.2
A           Cat2    0.3
B           Cat2    0.24
A           Cat3    13
B           Cat3    41
A           Cat4    60
B           Cat4    146
I want (A,B) under (Cat1,Cat2) to have the scale on the left, and (A,B) under (Cat3, Cat4) to have the scale on the right and all bars under A and B to be grouped together respectively. Can someone please tell me how to do this?
如果你对这篇内容有疑问,欢迎到本站社区发帖提问 参与讨论,获取更多帮助,或者扫码二维码加入 Web 技术交流群。

绑定邮箱获取回复消息
由于您还没有绑定你的真实邮箱,如果其他用户或者作者回复了您的评论,将不能在第一时间通知您!

发布评论
评论(1)
以下内容可能与您使用 ggplot2 所得到的内容最接近:
这通过分面并允许 ggplot2 单独设置轴来实现“双 y 轴”。我确信使用基本图形可以得到更接近您想要的东西,但这需要更多的考虑。
编辑
这是一个使用
twoord.plot的技巧。花了相当多的时间,但我从来没有使用过这个功能,所以可能有一个更简单的方法:The following is probably as close as you're going to get using
ggplot2:This achieves a "dual y axis" by faceting and allowing
ggplot2to set the axes separately. I'm sure it's possible to get something closer to what you want using base graphics, but it will take some more thought.EDIT
And here's a hack using the
twoord.plot. Took quite a bit of fiddling, but I've never used that function, so there may be an easier way: