在 Graphviz 中创建直边
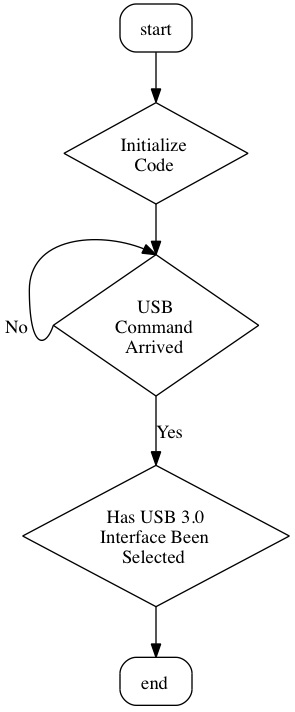
我想使用 Graphviz 创建流程图(类似于 Visio)。这是一个有向图示例。
digraph start_up {
node [style = rounded];
node [shape = rect] start end;
node [style = ""];
node [shape = diamond] "USB\nCommand\nArrived";
start -> "Initialize\nCode";
"Initialize\nCode" -> "USB\nCommand\nArrived";
"USB\nCommand\nArrived" -> "USB\nCommand\nArrived" [label="No" tailport=w headport=n];
"USB\nCommand\nArrived" -> "Has USB 3.0\nInterface Been\nSelected" [label = "Yes"];
 "Has USB 3.0\nInterface Been\nSelected" -> end
}
问题是当我在 Graphviz 中渲染此行时,由 "USB\nCommand\nArrived" -> 创建的行"USB\n命令\n到达" [label="No" tailport=w headport=n]; 看起来很丑。我不介意曲线,但这条线看起来变形了。您可以在此处查看 Graphviz 创建的内容

有没有办法让它看起来更好?
I want to create a flowchart (similar to Visio) using Graphviz. Here is a sample digraph.
digraph start_up {
node [style = rounded];
node [shape = rect] start end;
node [style = ""];
node [shape = diamond] "USB\nCommand\nArrived";
start -> "Initialize\nCode";
"Initialize\nCode" -> "USB\nCommand\nArrived";
"USB\nCommand\nArrived" -> "USB\nCommand\nArrived" [label="No" tailport=w headport=n];
"USB\nCommand\nArrived" -> "Has USB 3.0\nInterface Been\nSelected" [label = "Yes"];
 "Has USB 3.0\nInterface Been\nSelected" -> end
}
The problem is when I render this in Graphviz the line created by "USB\nCommand\nArrived" -> "USB\nCommand\nArrived" [label="No" tailport=w headport=n];
looks pretty ugly. I wouldn't mind curved lines, but this line looks deformed. You can see what Graphviz creates here

Is there a way to make this look better?
如果你对这篇内容有疑问,欢迎到本站社区发帖提问 参与讨论,获取更多帮助,或者扫码二维码加入 Web 技术交流群。

绑定邮箱获取回复消息
由于您还没有绑定你的真实邮箱,如果其他用户或者作者回复了您的评论,将不能在第一时间通知您!

发布评论
评论(1)
我认为最好通过例子来学习点。只需阅读我的评论,如果有任何不清楚的地方,我会很乐意回答。
作为侧节点:
虽然 graphviz 非常适合为大型数据集生成图形,但它对于创建 ER 图、流程图和序列图等内容就不那么出色了。这是可能的,而且相对简单,但是您必须投入大量时间来使某些事情正确进行,这通常是不合理的,因为您可以使用 Wsywig-GUI 建模工具在很短的时间内实现同样的事情。然而,您花在这方面的时间将帮助您学习该语言的语法和属性,当您需要可视化一些大型或复杂的问题时(GUI 建模工具将毫无用处),这确实会派上用场。
I think it's best to learn dot by example. Just read my comments and I'll be glad to answer if anything is unclear.
As a side node:
While graphviz is great for generating graphs for large datasets, it is less awesome for creating things like ER diagrams, flow-chars and sequence diagrams. It's possible and relatively straight forward, but the amount of time you have to put down to make something come out right is often unjustified because you could achieve the same thing with a Wsywig-GUI modeling tool in a fraction of the time. However, the time you spend doing that will help you towards learning the syntax and properties of the language which really comes in handy when you need to visualize some large or complex problem (where GUI modeling tools would be useless).