在 matplotlib 中向脉冲图的上升沿添加箭头
需要 matplotlib 中的帮助来找出以下问题的答案:
如何沿着绘图上的曲线/直线制作一个向上的箭头和一个向下的箭头?
如何调整图的范围/限制,使其边缘在图表上清晰可见?
我想在脉冲波的上升沿上添加箭头(脉冲下降沿上的向下箭头将是一个额外的好处),但无法找到一种简单的方法来做到这一点(注释页面上的示例提供了完全不同的目的)。
由于图片使事情变得更清晰,我的代码是:
from pylab import *

# How do I have arrows pointing up for every even value and pointing down for every odd value along Y axis for the highest freq.

baseFreqTimePeriod = 100
samplingFreqTimePeriod = 0.001

numberOfPulses = 10

def baseFreq(inputTime, timePeriod):

    sampleWindow = timePeriod

    return [ (1.0/(timePeriod/baseFreqTimePeriod)) if((i % sampleWindow) <= (sampleWindow / 2)) else 0.0 for i in inputTime ]

    '''
    output = []

    for i in inputTime:

        sampleIsAtPosition = i % sampleWindow

        if(sampleIsAtPosition <= (sampleWindow / 2)):

            output.append(1.0/(timePeriod/baseFreqTimePeriod))
        else:
            output.append(0.0)

    return output
    '''

t = arange(0.0, numberOfPulses * baseFreqTimePeriod, samplingFreqTimePeriod)

baseFreqFn = baseFreq(t, baseFreqTimePeriod)
plot(t, baseFreqFn, linewidth=1.0)

baseFreqFn = baseFreq(t, 2 * baseFreqTimePeriod)
plot(t, baseFreqFn, linewidth=2.0)

baseFreqFn = baseFreq(t, 3 * baseFreqTimePeriod)
plot(t, baseFreqFn, linewidth=2.0)

xlabel('time (uS)')
ylabel('Amplitude')
title('Test')
grid(True)
show()
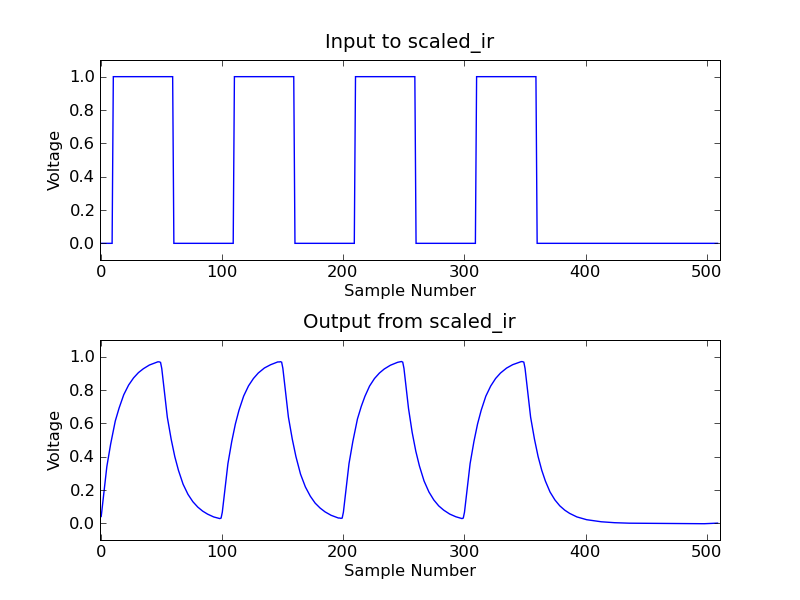
这会生成输出:

相反,这会让我happy (只绘制了前几个箭头)

另外,请注意图形的显示窗口如何使顶部全振幅波剪辑? (底部位也被遮挡)
如果我能看到峰峰值(轴超出数据范围),那就太好了,如下所示:
 (http://web.mit.edu/6.02/www/f2009/handouts/labs/lab2_7_1.png)
Need help in matplotlib to figure out the answers for,
How do you make an arrow pointing up and an arrow pointing down along a curve/line on the plot?
How do you adjust the range/limits of the plot so that the edges of it are visible clearly on the graph?
I wanted to add arrows on the rising edge of a pulsing wave, (a down arrow on the falling edges of the pulse would be a bonus) and could not figure out an easy way to do it (the examples on the annotation page serve a different purpose altogether).
Since a picture makes things clearer, my code is:
from pylab import *

# How do I have arrows pointing up for every even value and pointing down for every odd value along Y axis for the highest freq.

baseFreqTimePeriod = 100
samplingFreqTimePeriod = 0.001

numberOfPulses = 10

def baseFreq(inputTime, timePeriod):

    sampleWindow = timePeriod

    return [ (1.0/(timePeriod/baseFreqTimePeriod)) if((i % sampleWindow) <= (sampleWindow / 2)) else 0.0 for i in inputTime ]

    '''
    output = []

    for i in inputTime:

        sampleIsAtPosition = i % sampleWindow

        if(sampleIsAtPosition <= (sampleWindow / 2)):

            output.append(1.0/(timePeriod/baseFreqTimePeriod))
        else:
            output.append(0.0)

    return output
    '''

t = arange(0.0, numberOfPulses * baseFreqTimePeriod, samplingFreqTimePeriod)

baseFreqFn = baseFreq(t, baseFreqTimePeriod)
plot(t, baseFreqFn, linewidth=1.0)

baseFreqFn = baseFreq(t, 2 * baseFreqTimePeriod)
plot(t, baseFreqFn, linewidth=2.0)

baseFreqFn = baseFreq(t, 3 * baseFreqTimePeriod)
plot(t, baseFreqFn, linewidth=2.0)

xlabel('time (uS)')
ylabel('Amplitude')
title('Test')
grid(True)
show()
This generates the output:
Instead, this would make me happy (only first few arrows drawn)
Also, notice how the display window of the graph makes the top of the full amplitude wave clip? (bottom bits are obscured as well)
It would be great if I could see the peak-to-peak values (the axis extend beyond the range of the data), like in here:
 (http://web.mit.edu/6.02/www/f2009/handouts/labs/lab2_7_1.png)
如果你对这篇内容有疑问,欢迎到本站社区发帖提问 参与讨论,获取更多帮助,或者扫码二维码加入 Web 技术交流群。

绑定邮箱获取回复消息
由于您还没有绑定你的真实邮箱,如果其他用户或者作者回复了您的评论,将不能在第一时间通知您!


发布评论
评论(1)
要制作箭头,您可以使用
arrow例程:要制作向下的箭头,请设置负 dy。:
要更改绘图的限制,请使用
xlim和`ylim':有关于 arrow 的文档,xlim 和 ylim。还可以使用 注释 方法。
To make an arrow, you can use the
arrowroutine:to make a downward pointing arrow, set a negative dy.:
To change the limits of the plot, use
xlimand `ylim':There is documentation on arrow, xlim and ylim. It is also possible to make an arrow with text, using the annotate method.