将多个 ggplot2 绘图与网格对齐
上下文
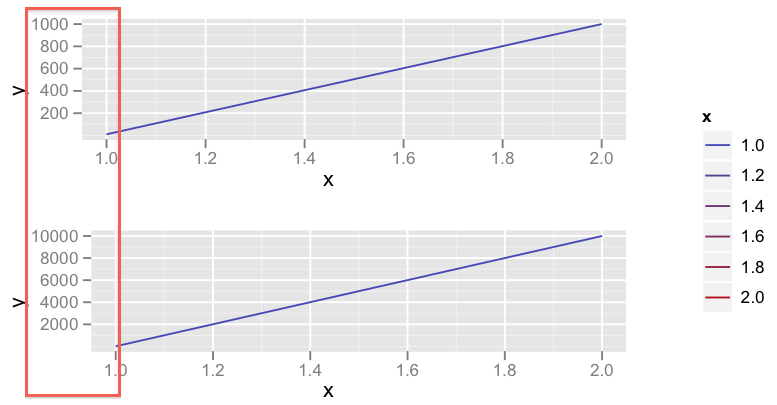
我想在同一页面上使用相同的图例绘制两个 ggplot2。 http://code.google.com/p/gridextra/wiki/arrangeGrob描述了如何做到这一点。这看起来已经不错了。但是...在我的示例中,我有两个具有相同 x 轴和不同 y 轴的图。当 y 轴的范围至少比其他图高 10 倍时(例如 10000 而不是 1000),ggplot2(或网格?)不会正确对齐图(请参见下面的输出)。
问题
如何使用两个不同的 y 轴对齐图的左侧?
示例代码
x = c(1, 2)
y = c(10, 1000)
data1 = data.frame(x,y)
p1 <- ggplot(data1) + aes(x=x, y=y, colour=x) + geom_line()

y = c(10, 10000)
data2 = data.frame(x,y)
p2 <- ggplot(data2) + aes(x=x, y=y, colour=x) + geom_line()


# Source: http://code.google.com/p/gridextra/wiki/arrangeGrob
leg <- ggplotGrob(p1 + opts(keep="legend_box"))
legend=gTree(children=gList(leg), cl="legendGrob")
widthDetails.legendGrob <- function(x) unit(3, "cm")
grid.arrange(
  p1 + opts(legend.position="none"),
  p2 + opts(legend.position="none"),
  legend=legend, main ="", left = "")
输出

Context
I want to plot two ggplot2 on the same page with the same legend. http://code.google.com/p/gridextra/wiki/arrangeGrob discribes, how to do this. This already looks good. But... In my example I have two plots with the same x-axis and different y-axis. When the range of the the y-axis is at least 10 times higher than of the other plot (e.g. 10000 instead of 1000), ggplot2 (or grid?) does not align the plots correct (see Output below).
Question
How do I also align the left side of the plot, using two different y-axis?
Example Code
x = c(1, 2)
y = c(10, 1000)
data1 = data.frame(x,y)
p1 <- ggplot(data1) + aes(x=x, y=y, colour=x) + geom_line()

y = c(10, 10000)
data2 = data.frame(x,y)
p2 <- ggplot(data2) + aes(x=x, y=y, colour=x) + geom_line()


# Source: http://code.google.com/p/gridextra/wiki/arrangeGrob
leg <- ggplotGrob(p1 + opts(keep="legend_box"))
legend=gTree(children=gList(leg), cl="legendGrob")
widthDetails.legendGrob <- function(x) unit(3, "cm")
grid.arrange(
  p1 + opts(legend.position="none"),
  p2 + opts(legend.position="none"),
  legend=legend, main ="", left = "")
Output

如果你对这篇内容有疑问,欢迎到本站社区发帖提问 参与讨论,获取更多帮助,或者扫码二维码加入 Web 技术交流群。

绑定邮箱获取回复消息
由于您还没有绑定你的真实邮箱,如果其他用户或者作者回复了您的评论,将不能在第一时间通知您!

发布评论
评论(3)
执行相同操作但更通用的一种更简洁的方法是使用格式化程序 arg:
对第二个图执行相同的操作,并确保设置宽度 >= 您在两个图上期望的最宽数字。
A cleaner way of doing the same thing but in a more generic way is by using the formatter arg:
Do the same for your second plot and make sure to set the width >= the widest number you expect across both plots.
1.使用cowplot包:
2. 使用ggbio 包:
注意: 似乎有一个 bug,x 刻度没有对齐。 (测试于 17/03/2016,ggbio_1.18.5)
1. Using cowplot package:
2. Using
tracksfrom ggbio package:Note: There seems to be a bug, x ticks do not align. (tested on 17/03/2016, ggbio_1.18.5)
如果您不介意无耻的拼凑,只需在
p1中最长的标签中添加一个额外的字符,如下所示:我有两个基本问题,如果您有理由,希望您能原谅:
1)为什么不在两者上使用相同的 y 轴?我觉得这是一种更直接的方法,在上面的示例中通过将
scale_y_continuous(limits = c(0, 10000))添加到p1可以轻松实现。2)
facet_wrap提供的功能在这里还不够吗?很难知道你的数据结构实际上是什么样的,但这里有一个我如何做到这一点的玩具示例:If you don't mind a shameless kludge, just add an extra character to the longest label in
p1, like this:I have two underlying questions, which I hope you'll forgive if you have your reasons:
1) Why not use the same y axis on both? I feel like that's a more straight-forward approach, and easily achieved in your above example by adding
scale_y_continuous(limits = c(0, 10000))top1.2) Is the functionality provided by
facet_wrapnot adequate here? It's hard to know what your data structure is actually like, but here's a toy example of how I'd do this: