根据 x 值的数量增加 matplotlib 中图形的宽度
我试图使用matplotlib绘制条形图。要绘制的项目数量可能会有所不同。我无法使用常量(例如 6.,8. 或 8.,12. 等)设置 figure.set_size_inches(w,h) 或 set_figwidth(w) ,因为我无法提前知道 w 或 h 的值应该是多少。我希望图形的宽度随着要绘制的项目数量的增加而增加。有人可以告诉我如何做到这一点吗?
import pylab

def create_barchart(map):
    xvaluenames = map.keys()
    xvaluenames.sort()
    yvalues = map.values()
    max_yvalue = get_max_yvalue(yvalues)
    xdata = range(len(xvaluenames))
    ydata = [map[x] for x in xvaluenames]
    splitxdata = [x.split('-',1) for x in xvaluenames]
    xlabels = [x[0] for x in splitxdata]
    figure = pylab.figure()
    ax = figure.add_subplot(1,1,1)
    figsize = figure.get_size_inches()
    print 'figure size1=',figsize,'width=',figsize[0],'height=',figsize[1]
    barwidth = .25
    ystep =  max_yvalue/5
    pylab.grid(True)
    if xdata and ydata:
        ax.bar(xdata, ydata, width=barwidth,align='center',color='orange')
        ax.set_xlabel('xvalues',color='green')
        ax.set_ylabel('yvalues',color='green')
        ax.set_xticks(xdata)
        ax.set_xlim([min(xdata) - 0.5, max(xdata) + 0.5])
        ax.set_xticklabels(xlabels)
        ax.set_yticks(range(0,max_yvalue+ystep,ystep))
        ax.set_ylim(0,max(ydata)+ystep)
    figure.autofmt_xdate(rotation=30)
    figure.savefig('mybarplot',format="png")
    print 'figure size2=',figure.get_size_inches()
    pylab.show()

def get_max_yvalue(yvals):
    return max(yvals) if yvals else 0
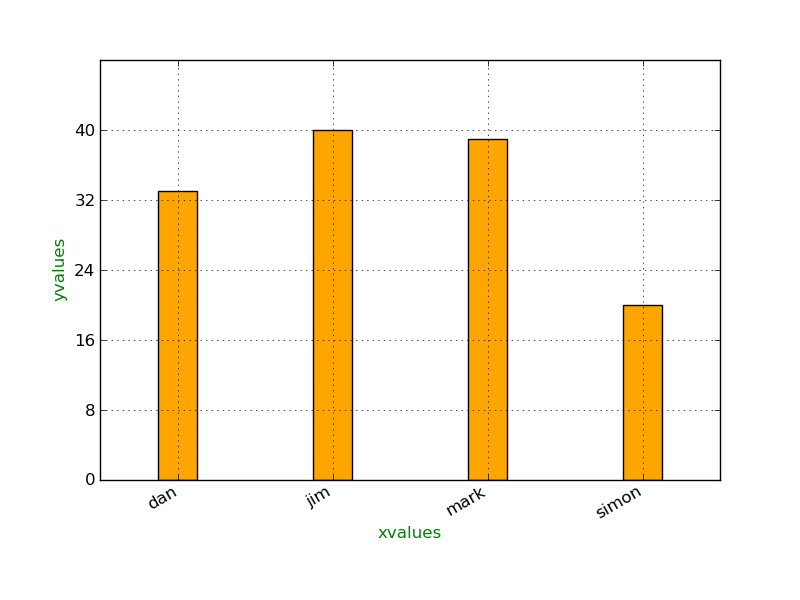
如果我尝试使用一小部分项目,我会得到
if __name__=='__main__':
    datamap = dict(mark=39,jim=40, simon=20,dan=33)
    print datamap
    create_barchart(datamap)

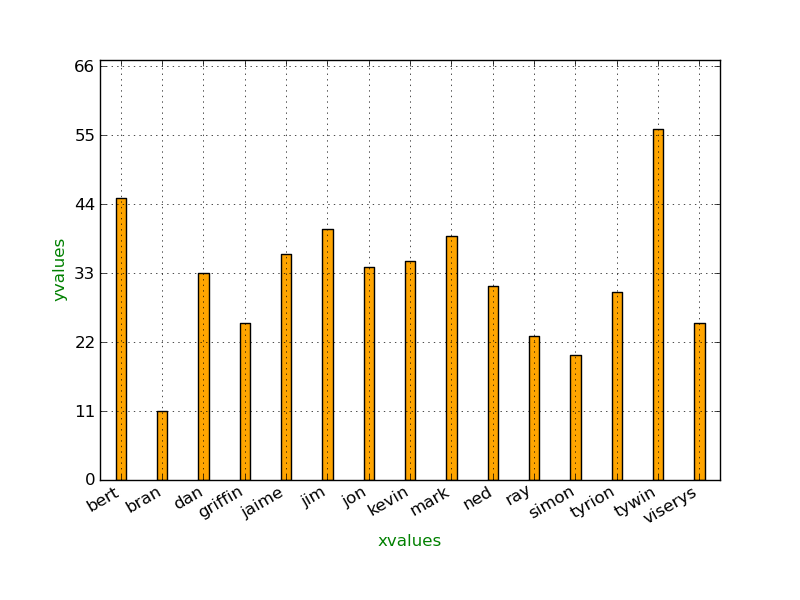
但如果我使用更大的集合
datamap = dict(mark=39,jim=40, simon=20,dan=33)
additional_values= dict(jon=34,ray=23,bert=45,kevin=35,ned=31,bran=11,tywin=56,tyrion=30,jaime=36,griffin=25,viserys=25)
datamap.update(additional_values)
create_barchart(datamap)

这看起来很糟糕, 我想知道是否有一种方法可以根据要绘制的项目数量来增加图形的宽度,在两种情况下保持条形的宽度相同
I was trying to draw a barchart using matplotlib.The number of items to be plotted can vary . I cannot set the figure.set_size_inches(w,h) or set_figwidth(w) with constants(like 6.,8. or 8.,12. etc),since I cannot tell in advance what the value of w or h should be.I want the width of figure to increase as the number of items to be plotted increases.Can someone tell me how I can do this?
import pylab

def create_barchart(map):
    xvaluenames = map.keys()
    xvaluenames.sort()
    yvalues = map.values()
    max_yvalue = get_max_yvalue(yvalues)
    xdata = range(len(xvaluenames))
    ydata = [map[x] for x in xvaluenames]
    splitxdata = [x.split('-',1) for x in xvaluenames]
    xlabels = [x[0] for x in splitxdata]
    figure = pylab.figure()
    ax = figure.add_subplot(1,1,1)
    figsize = figure.get_size_inches()
    print 'figure size1=',figsize,'width=',figsize[0],'height=',figsize[1]
    barwidth = .25
    ystep =  max_yvalue/5
    pylab.grid(True)
    if xdata and ydata:
        ax.bar(xdata, ydata, width=barwidth,align='center',color='orange')
        ax.set_xlabel('xvalues',color='green')
        ax.set_ylabel('yvalues',color='green')
        ax.set_xticks(xdata)
        ax.set_xlim([min(xdata) - 0.5, max(xdata) + 0.5])
        ax.set_xticklabels(xlabels)
        ax.set_yticks(range(0,max_yvalue+ystep,ystep))
        ax.set_ylim(0,max(ydata)+ystep)
    figure.autofmt_xdate(rotation=30)
    figure.savefig('mybarplot',format="png")
    print 'figure size2=',figure.get_size_inches()
    pylab.show()

def get_max_yvalue(yvals):
    return max(yvals) if yvals else 0
if I try with a small set of items,I get
if __name__=='__main__':
    datamap = dict(mark=39,jim=40, simon=20,dan=33)
    print datamap
    create_barchart(datamap)

but if I use a larger set
datamap = dict(mark=39,jim=40, simon=20,dan=33)
additional_values= dict(jon=34,ray=23,bert=45,kevin=35,ned=31,bran=11,tywin=56,tyrion=30,jaime=36,griffin=25,viserys=25)
datamap.update(additional_values)
create_barchart(datamap)

This looks awful,
I am wondering if there is a way to increase the width of figure,according to the number of items to be plotted,keeping the width of bars in both cases same
如果你对这篇内容有疑问,欢迎到本站社区发帖提问 参与讨论,获取更多帮助,或者扫码二维码加入 Web 技术交流群。

绑定邮箱获取回复消息
由于您还没有绑定你的真实邮箱,如果其他用户或者作者回复了您的评论,将不能在第一时间通知您!

发布评论
评论(1)
您可以在初始化图形时设置宽度:
将
figure = pylab.figure()行替换为上述三行,您就得到了您所要求的内容。You can set the width when you initialize the figure:
Replace the
figure = pylab.figure()line with the above three lines and you get what your asking for.