使用多个标签手动注释一个面板
这与这个问题非常相似(链接),但我不太确定如何根据我的需要操纵它。
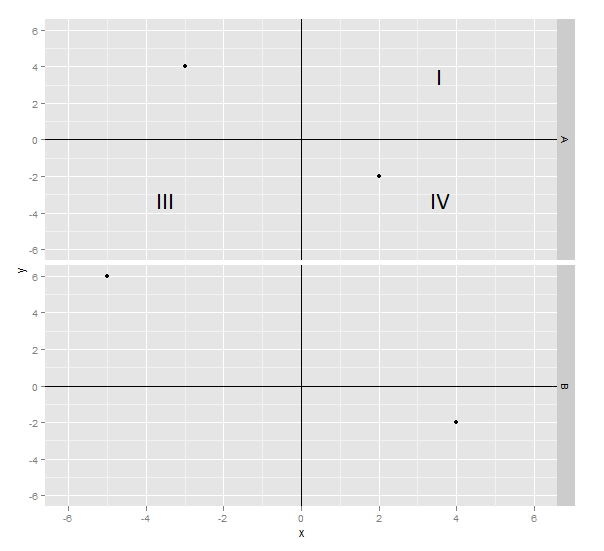
我有一个包含两个面板的多面图,我想在第一个面板中标记三个象限,并且仅在第一个面板中标记。
这是一个模拟数据集:
dfr=data.frame(
 variable=rep(c("A","B"),each=2),
 x=c(2,-3,4,-5),
 y=c(-2,4,-2,6))
这是情节:
p=ggplot(dfr,aes(x,y))+
 geom_point()+
 facet_grid(variable~.)+
 scale_x_continuous(limits=c(-6,6))+
 scale_y_continuous(limits=c(-6,6))+
 geom_hline(yintercept=0)+
 geom_vline(xintercept=0)
这就是我想要完成的任务:

This is very similar to this question (link), but I'm not quite sure how to manipulate it for my needs.
I have a faceted plot with two panels, and I would like to label three quadrants in the first panel and only the first panel.
Here is a mock data set:
dfr=data.frame(
 variable=rep(c("A","B"),each=2),
 x=c(2,-3,4,-5),
 y=c(-2,4,-2,6))
And here is the plot:
p=ggplot(dfr,aes(x,y))+
 geom_point()+
 facet_grid(variable~.)+
 scale_x_continuous(limits=c(-6,6))+
 scale_y_continuous(limits=c(-6,6))+
 geom_hline(yintercept=0)+
 geom_vline(xintercept=0)
This is what I would like to accomplish:

如果你对这篇内容有疑问,欢迎到本站社区发帖提问 参与讨论,获取更多帮助,或者扫码二维码加入 Web 技术交流群。

绑定邮箱获取回复消息
由于您还没有绑定你的真实邮箱,如果其他用户或者作者回复了您的评论,将不能在第一时间通知您!

发布评论
评论(1)
您始终可以使用所需标签创建单独的数据框,并使用
geom_text绘制它们:You can always create a separate data frame with the desired labels and plot them using
geom_text: