如何使用 jasperReport 最小化比例以获得更详细的数字?
我正在使用 jasperReport/ireport 4.0
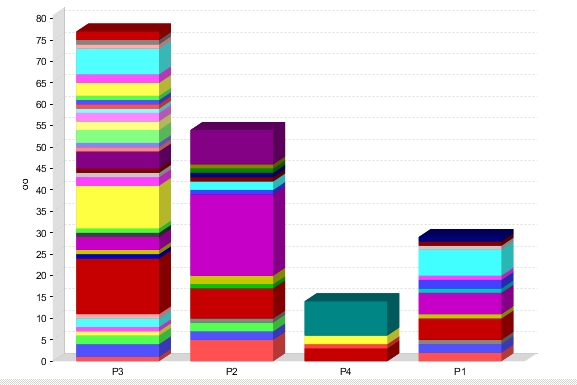
使用 jasper 我生成一个包含 barChart 的报告,其中包含很多信息, x轴上的数字不清晰和精确,从图表中我无法说出我有多少问题, 当用户阅读报告时,他无法说出正确的值
如何最小化比例以获得更详细的数字?
我的图表:

I'am using jasperReport/ireport 4.0
Using jasper I generate a report contain barChart that contain a lot of informations,
The number on the x axis is not clear and precise ,from the chart I cant tell how many issue I have ,
when the user read the report he can't tell the right value
How can I minimise the scale to have more detailed number?
My chart:

如果你对这篇内容有疑问,欢迎到本站社区发帖提问 参与讨论,获取更多帮助,或者扫码二维码加入 Web 技术交流群。

绑定邮箱获取回复消息
由于您还没有绑定你的真实邮箱,如果其他用户或者作者回复了您的评论,将不能在第一时间通知您!

发布评论
评论(1)
您需要使用图表定制器类来执行此操作。创建一个实现JRChartCustomizer 接口的类,然后在customize() 方法中添加以下代码:
图表引擎应始终选择不会导致刻度重叠的最小刻度单位。使用此代码,您的图表有望在每个值或每 2 个值处放置刻度。
You'll need to use a chart customizer class to do this. Create a class that implements the JRChartCustomizer interface, then in the customize() method add the following code:
The chart engine should always pick the smallest tick unit that does not cause the ticks to overlap. Using this code your chart should hopefully place ticks at every value or every 2 values.